




 Rapid urbanization and tourism development are reshaping land-cover patterns in Phu Quoc, increasing the need for effective resource monitoring and management. Using Landsat satellite imagery combined with machine-learning algorithms, a team of Vietnamese researchers analyzed land-cover changes during 2010–2025. The study identified areas where land cover remained stable, locations experiencing frequent transitions, and areas classified as having undergone land-cover recovery. The findings provide additional scientific evidence to support land resource monitoring, forest conservation, and more effective land-use planning in the area.

Remote sensing strengthens land-cover change monitoring
Phu Quoc has considerable natural resources, distinctive landscapes, and diverse ecosystems, while urban development, infrastructure expansion, and tourism are also growing rapidly. These processes are reshaping land-cover patterns across the island, as reflected in transitions among different land-cover classes. In this context, monitoring change requires more than measuring the area occupied by each land-cover class at a given point in time. It also requires determining where changes occur, the sequence in which they take place, and how frequently they happen.
These issues were addressed by Nguyen Truong Anh Kiet, Dang Thi Hong Ngoc, Nguyen Kieu Diem, Phan Hoang Vu, Ngo Thi Hieu, and Bui Xuan Khanh in their study applying Landsat imagery to analyze land-cover changes in Phu Quoc Special Zone, An Giang province.
The study used Landsat 5 and Landsat 8 satellite imagery, together with the Normalized Difference Vegetation Index (NDVI), Normalized Difference Built-up Index (NDBI), and Modified Normalized Difference Water Index (MNDWI), to identify four land-cover classes: forest, built-up land, vegetation, and water bodies. The data were processed using Google Earth Engine, with the Random Forest algorithm applied to classify imagery for four observation years: 2010, 2015, 2020, and 2025.
A notable feature of the research approach is its tracking of the land-cover state of each pixel over time, rather than simply comparing maps from two separate observation dates. Each pixel was encoded according to the sequence of the four observation years, making it possible to identify locations where the initial land-cover class persisted, changed to another class, or returned to its previous state. The number of transitions across the three consecutive periods was also determined, allowing areas with different levels of stability and frequency of change to be distinguished.
This approach is particularly relevant in rapidly developing areas, where land-cover classes are often interspersed and boundaries between forests, vegetation, built-up areas, and water bodies may shift over time. Combining multiple spectral indices with machine-learning algorithms improves the ability to distinguish among land-cover classes, while the cloud-based platform supports the processing of large volumes of remote sensing data across extensive geographic areas.
Validation results showed that the overall accuracy of the classification maps ranged from 87.6% to 98.1% across the four observation years. These results provide an important basis for using the maps to analyze land-cover changes and identify areas requiring attention in land resource management.
Mapping areas of persistent forest cover
One of the study's notable findings concerns the persistence of forest cover during 2010–2025. The analysis identified 27,189.57 ha of forest cover that remained unchanged across the observation periods, equivalent to 89.17% of the forest-cover area recorded in 2010. These areas were concentrated mainly in the northern, northeastern, and eastern parts of the island, forming relatively stable components of its overall land-cover pattern.
This finding provides valuable spatial information for forest conservation. Rather than relying solely on forest area statistics recorded at individual points in time, the time-series maps make it possible to identify specific areas where forest cover persisted throughout the study period. This information can help prioritize monitoring, maintain the continuity of forest patches, and control activities that may alter land cover in adjoining areas.
In addition to areas of persistent forest cover, the study recorded transitions between forest and other land-cover classes. Of the area classified as forest in 2010, 903.98 ha, equivalent to 2.96%, was classified as having transitioned to built-up land by 2025. Another 757.77 ha transitioned to vegetation, while a smaller area was classified as water bodies. These findings highlight the need to consider both areas of stable forest cover and locations showing signs of change, particularly those adjoining built-up areas and zones of economic activity.
Another finding was that approximately 1,553.31 ha of pixels were classified as having returned to their initial forest-cover state following intermediate changes. This indicates that land-cover change did not necessarily proceed in one direction; in some cases, previously recorded land-cover conditions were re-established. Such information can help identify areas requiring further monitoring, assess potential recovery, and determine appropriate management measures. However, the return of a pixel to the forest-cover class does not necessarily indicate that forest ecological quality or the overall condition of the forest has been fully restored. These aspects require verification through field surveys and specialized datasets.
The study also recorded an increase in the area classified as forest cover, from 30,492.44 ha in 2010 to 37,011.34 ha in 2025. These figures are derived from Landsat image classification and should be interpreted in terms of land cover rather than equated directly with forest inventory statistics. Differences in definitions, assessment methods, and data resolution mean that the two datasets are not fully comparable. Clearly distinguishing between these data systems helps ensure that research findings are interpreted and applied within their appropriate scientific scope.
Identifying areas with frequent land-cover transitions
Land-cover changes in Phu Quoc exhibit distinct spatial patterns. The analysis of the number of transitions showed that 32,815.75 ha remained unchanged throughout the study period. By contrast, areas experiencing one or more transitions were concentrated in locations associated with urban development, infrastructure expansion, and tourism activities.
Notably, areas experiencing two or more pixel-level transitions covered a total of 11,120.86 ha. These areas were concentrated along the central-western corridor, in the southern part of the island, and in several coastal areas in the north. These locations have also experienced urban development, transportation infrastructure expansion, tourism, and resort development. Meanwhile, the interior forest areas in the northern and eastern parts of the island exhibited greater stability.
This spatial distribution demonstrates how analyzing the number of land-cover transitions can provide an additional perspective for land management. An area undergoing extensive change during a single period may have different characteristics from one experiencing repeated transitions across multiple periods. Identifying transition frequency helps distinguish locations with isolated changes from those where land-cover classes shift repeatedly, thereby supporting the prioritization of monitoring efforts.
Transitions between vegetation and built-up land also represent an important finding. The study showed that 29.24% of the area classified as vegetation in 2010 was classified as built-up land by 2025. These changes may be associated with the development of residential areas, infrastructure facilities, and tourism projects in expanding development zones. Conversely, some areas previously classified as built-up land were subsequently classified as vegetation, reflecting changes in surface conditions over different periods.
It is important to note, however, that remote sensing imagery captures land-cover conditions at the time of image acquisition and does not, by itself, make it possible to isolate the effects of individual projects or determine the specific causes of land-cover conversion. Therefore, spatial findings should be integrated with land-use planning information, land management records, high-resolution imagery, and field surveys to support more comprehensive assessments.
The value of land-cover change maps lies not only in their ability to depict surface changes but also in the continuous temporal information they provide. These maps offer supplementary data that can help management authorities identify areas requiring inspection, monitor changes along forest edges and at interfaces with built-up areas, and assess the consistency between existing land-cover conditions and land-use plans.
Strengthening the scientific basis for land management
Based on their analysis, the authors proposed three main priorities: conserving areas where forest cover has remained stable, restoring areas experiencing forest-cover decline, and controlling the expansion of built-up land in locations with frequent land-cover transitions. These measures are directly linked to the spatial patterns identified in the maps, supporting a differentiated management approach rather than applying the same measures across the entire study area.
For areas with persistent forest cover, priority should be given to maintaining forest continuity, controlling construction activities in adjoining areas, and strengthening regular monitoring using remote sensing data. In areas where forest cover has declined or shows signs of re-establishment, the study recommends protecting areas to allow natural regeneration, planting additional native trees, and improving connectivity among forest patches. These measures are important for maintaining ecological integrity and strengthening connectivity among forest areas across the island.
In areas experiencing frequent land-cover transitions, controlling the expansion of built-up areas should be considered alongside the need to protect land resources and maintain ecological functions. Areas undergoing conversion between vegetation and built-up land require particular attention to ensure the maintenance of green spaces, permeable surfaces, and buffer zones around forests and water bodies. Locations classified as having transitioned from water bodies to built-up land should be verified using high-resolution imagery and field surveys before management decisions are made, as differences in image acquisition dates and surface characteristics may affect classification results.
From a methodological perspective, the study also suggests opportunities to expand the application of remote sensing for monitoring land-cover changes in rapidly developing areas. The authors propose integrating Landsat data with Sentinel-2 imagery or higher-resolution images, while using annual image time series to determine more precisely the timing, rate, and trajectory of land-cover transitions. Combining these data sources could improve the identification of small structures, narrow roads, and forest-edge areas that remain difficult to distinguish using Landsat imagery at a spatial resolution of 30 m.
The study's contribution lies not only in applying remote sensing technology to land-cover mapping but also in its approach to analyzing changes at the same locations over successive observation periods. This method provides additional information on land-cover persistence, transition frequency, and the re-establishment of previous land-cover states, thereby expanding the evidence base for land resource management.
For Phu Quoc, where economic and tourism development needs to go hand in hand with ecosystem conservation and the protection of natural resources, such spatial information has practical value for monitoring existing conditions, reviewing land-use plans, and identifying priority areas for management. When integrated with inventory data, planning information, and field survey results, remote sensing can serve as a valuable supporting tool, contributing to improved land management and sustainable development.
Sources: This article is based on the study “Using Landsat imagery for analyzing land cover changes during the 2010 – 2025 period in the Phu Quoc Special Zone, An Giang province and proposing solutions for eficcient land use” by Nguyen Truong Anh Kiet, Dang Thi Hong Ngoc, Nguyen Kieu Diem, Phan Hoang Vu, Ngo Thi Hieu and Bui Xuan Khanh, published in the Science Journal of Agriculture and Environment, Issue 1, September 2026.
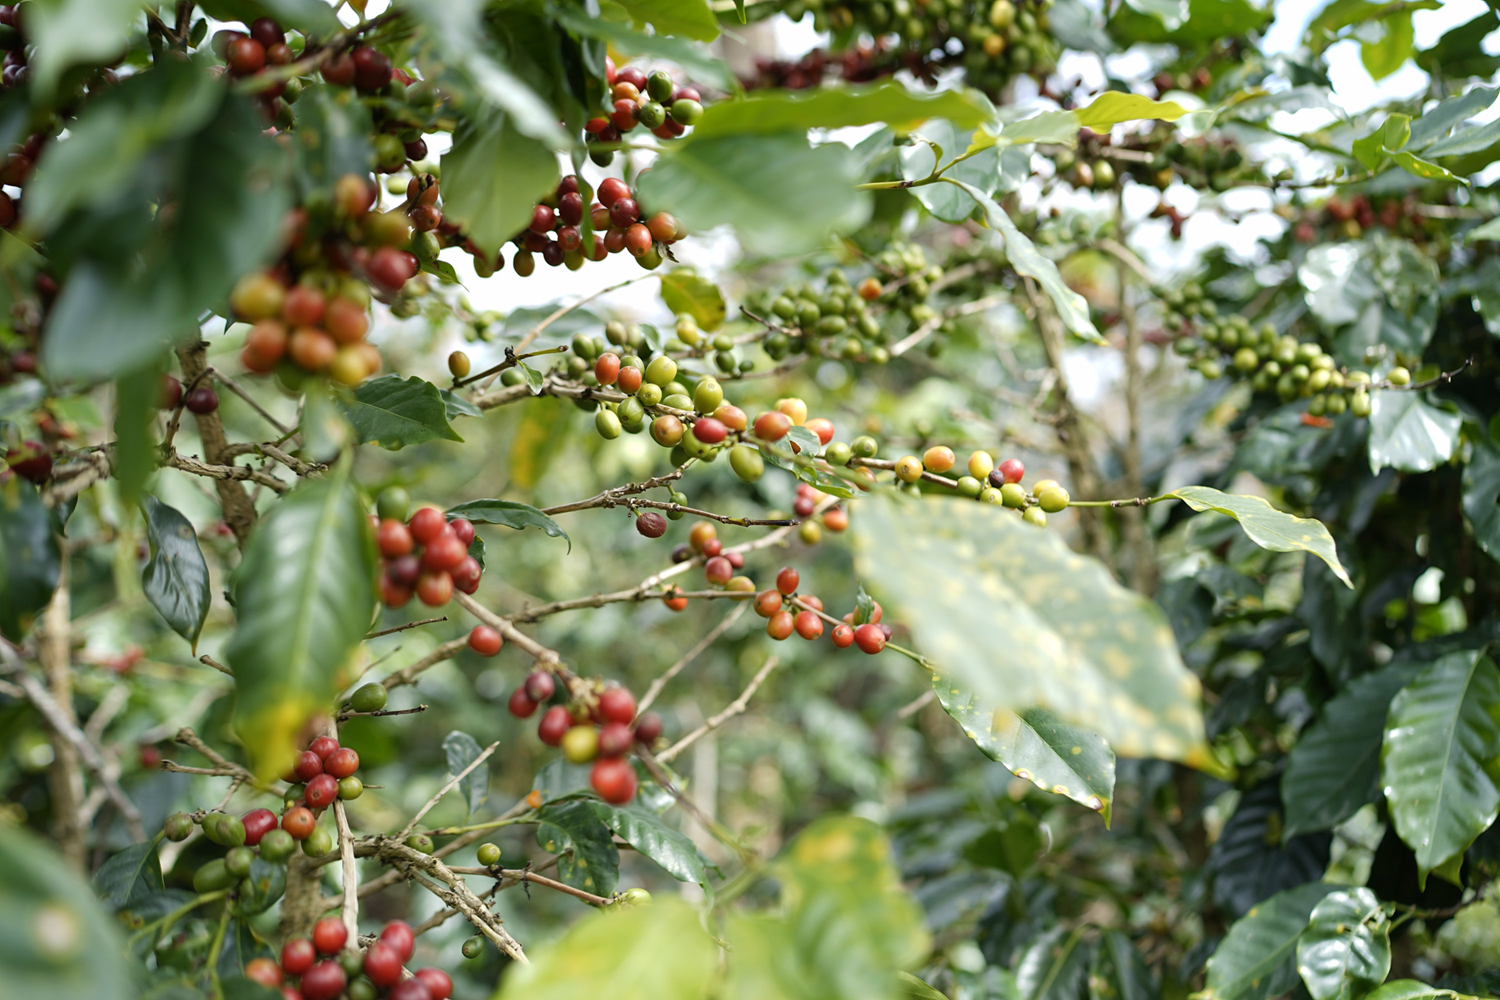
By integrating remote sensing data, geographic information systems (GIS), and the Analytic Hierarchy Process (AHP), researchers from the Institute of Water Resources Planning developed a map assessing the potential suitability of sloping land for Arabica coffee cultivation in Dien Bien province. The assessment classified 276,597 ha as having potential and 92,872 ha as having very high potential, providing a scientific basis for selecting growing areas, planning production, and restructuring crops in accordance with local natural conditions.
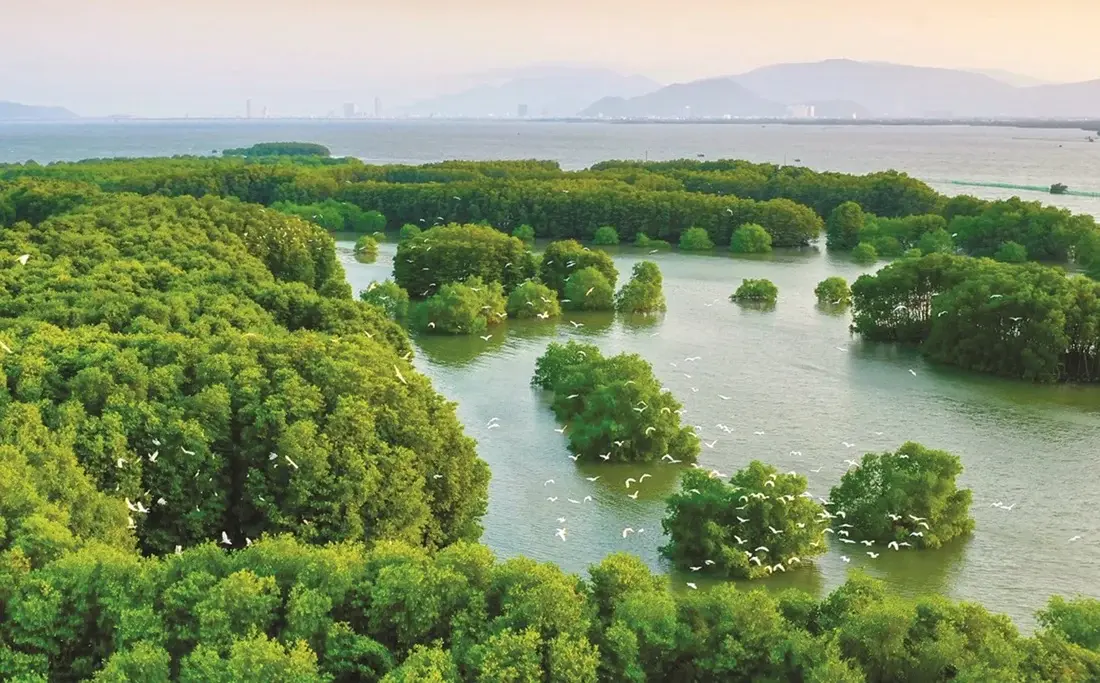
By integrating Sentinel-2 satellite imagery, GEDI data and the Google Earth Engine platform, researchers Vu Thi Hoai Thu, Dang Thi Kieu Oanh and Trieu Anh Ngoc have developed a map showing the spatial distribution of aboveground carbon stocks across vegetated classes in the Thi Nai Lagoon area. The total aboveground carbon stock was estimated at more than 71,500 metric tons, demonstrating the potential of combining remote sensing data and machine learning for biomass monitoring, identifying areas of carbon accumulation and supporting lagoon ecosystem management.
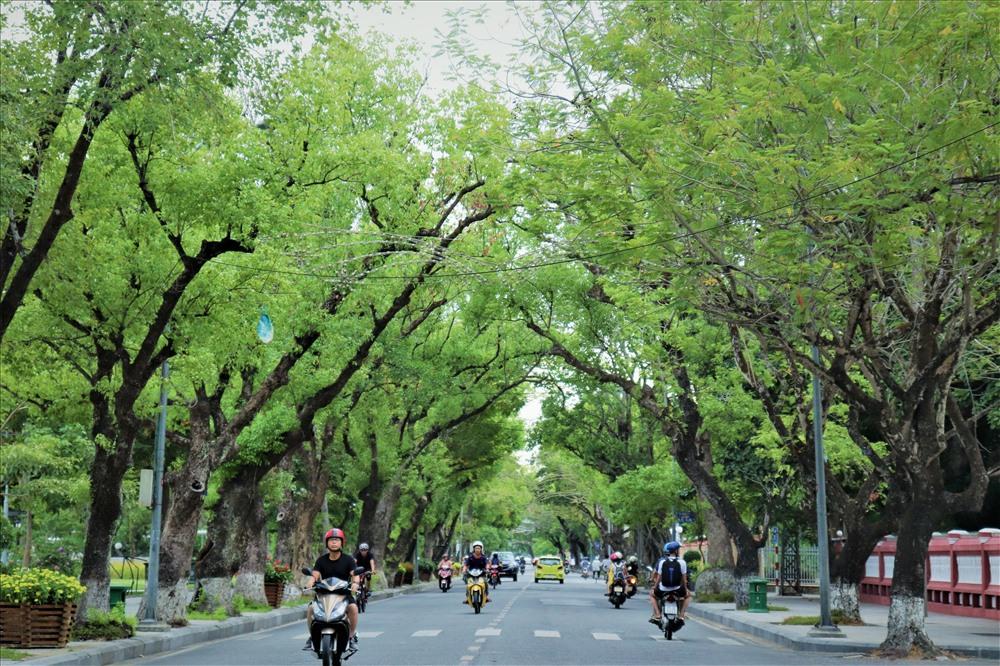
Urban green space plays an important role in improving environmental quality and supporting sustainable urban development. A study by Nguyen Ngoc Thanh, Nguyen Duy Phong, Tran Thi Thuy Huong and Pham Quoc Trung employed a hierarchical classification method based on Normalized Difference Vegetation Index (NDVI) thresholds derived from Sentinel-2A satellite data to identify urban green spaces in Hue City Center. A dataset comprising 100 ground-truth points was used to validate the classification maps.
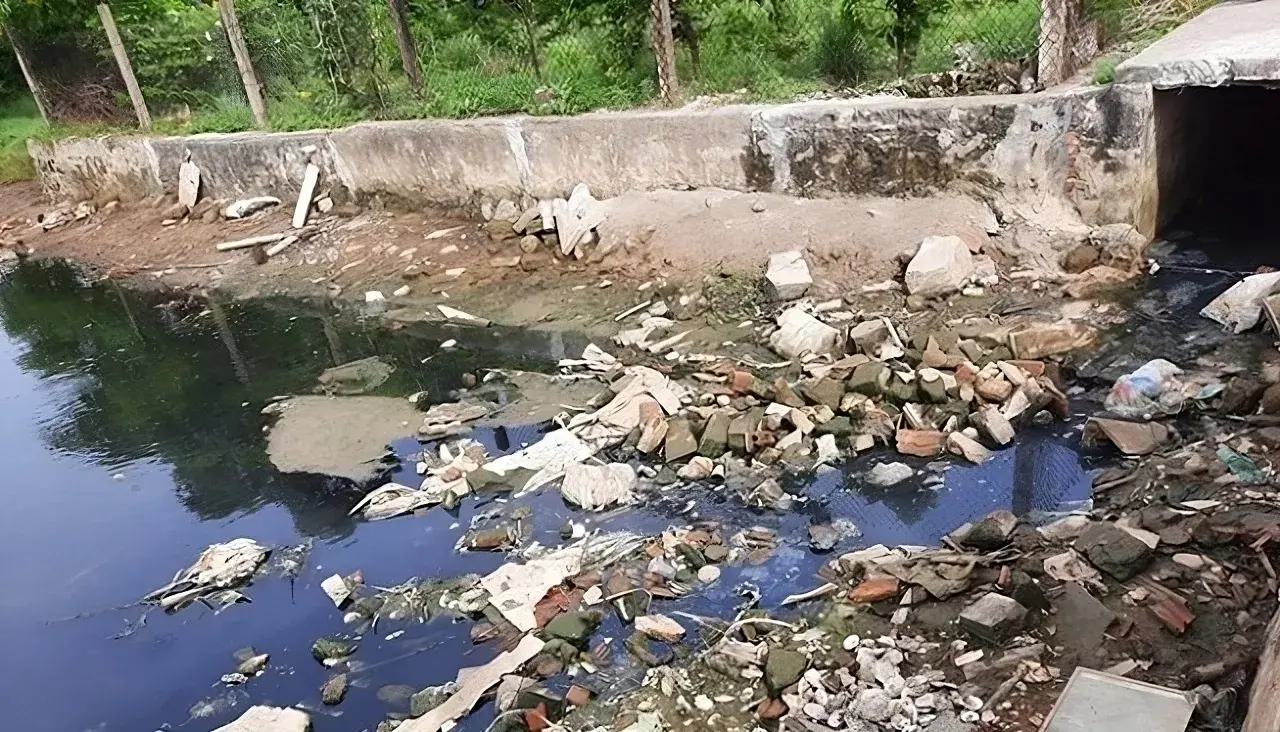
The application of low-frequency ultrasound irradiation to domestic wastewater has demonstrated its potential to reduce organic matter and microbial counts in experimental samples, according to a study by Hoang Duc An, Huynh Thi Minh Thanh, and Vo Thi Hong Phuong of the Faculty of Natural Sciences, Quy Nhon University. The findings also indicate that treatment performance depends on operating conditions and influent wastewater quality, suggesting that ultrasound could serve as a supplementary step in wastewater treatment processes.
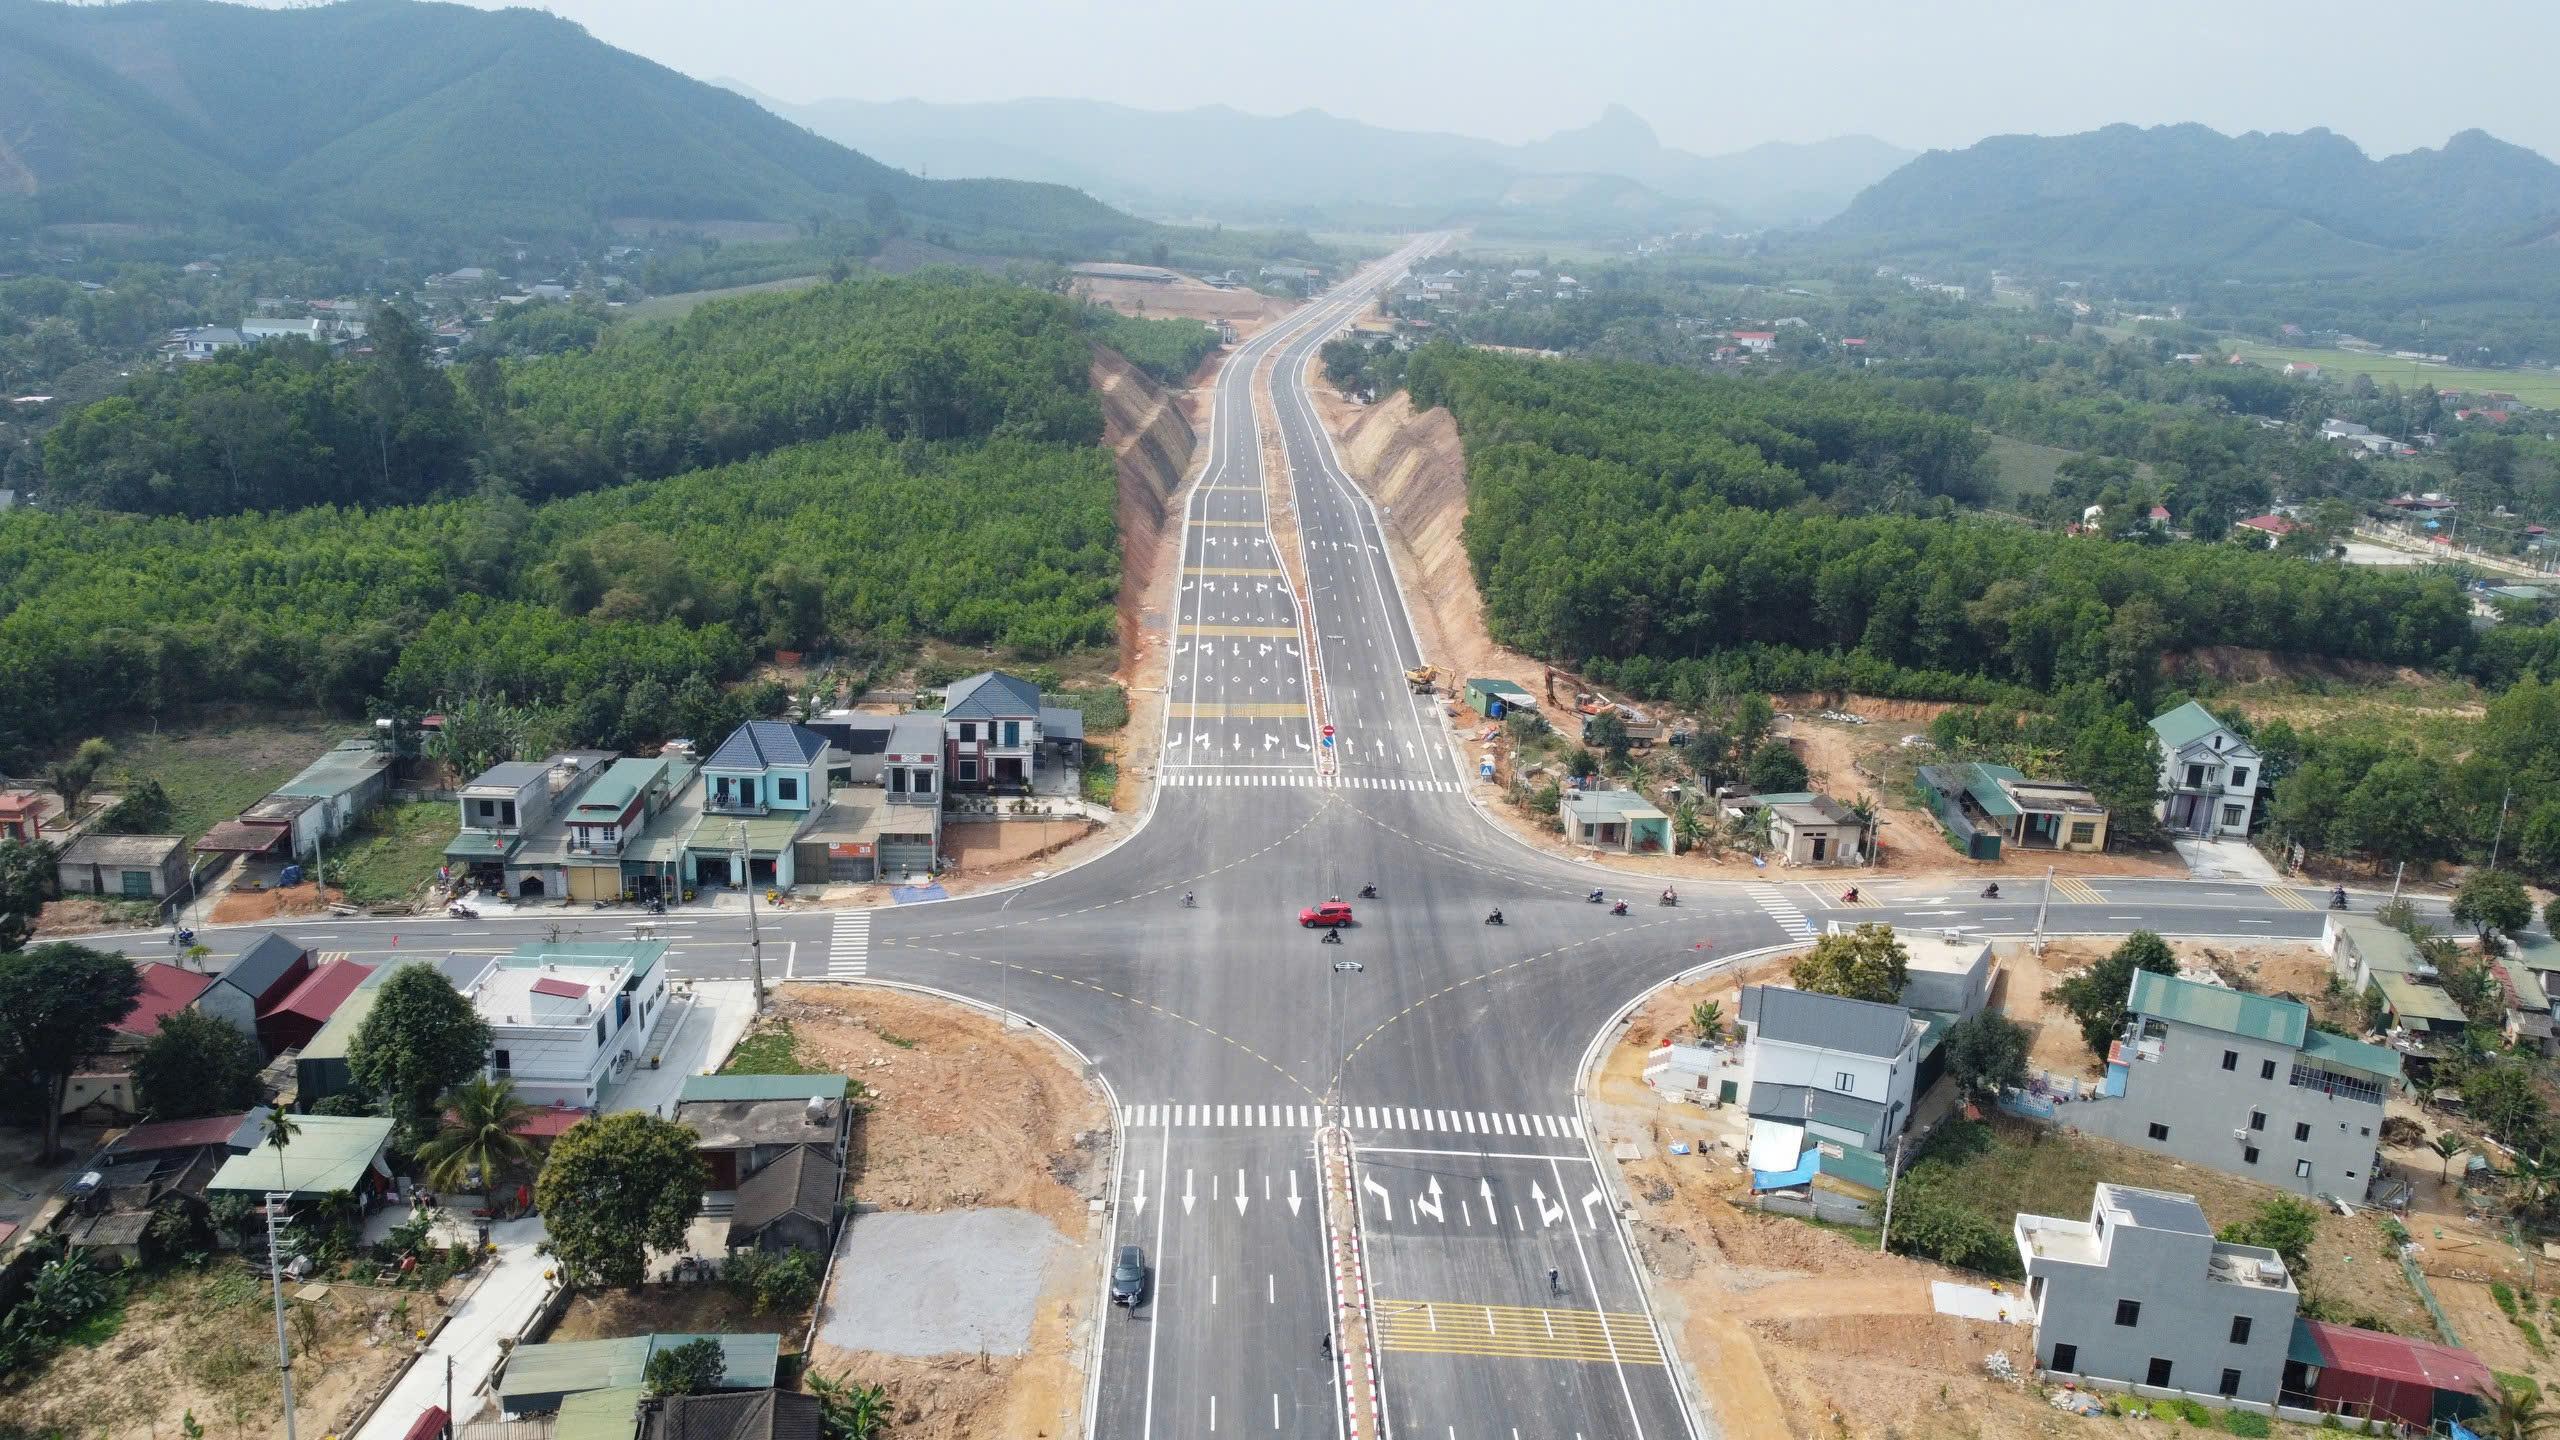
A study by Tran Thanh Son and colleagues on the Ben En–Ben Sung town center road project, in what is now Nhu Thanh commune, Thanh Hoa province, Viet Nam, demonstrates that integrating unmanned aerial vehicle (UAV) photogrammetry with MicroStation V8i can produce a land-use status map that meets the accuracy requirements for large-scale mapping. The results provide detailed geospatial data and identify 136,032.6 m² of land within the project’s acquisition boundary, supporting land inventory and the preparation of compensation, assistance, and resettlement plans.