



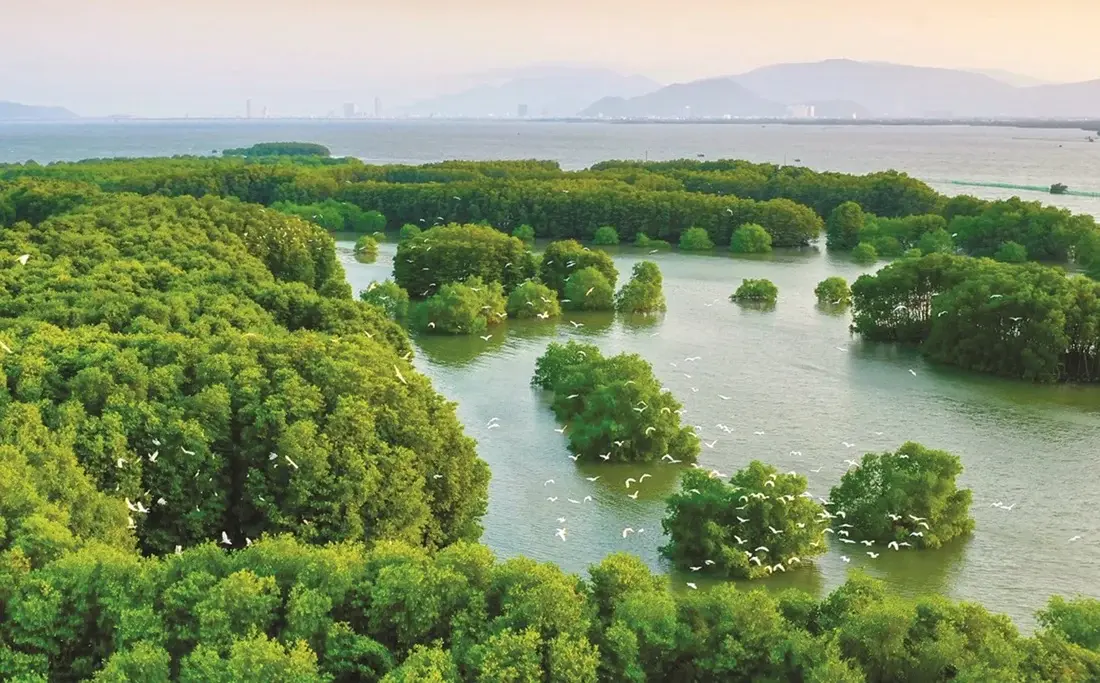
 By integrating Sentinel-2 satellite imagery, GEDI data and the Google Earth Engine platform, researchers Vu Thi Hoai Thu, Dang Thi Kieu Oanh and Trieu Anh Ngoc have developed a map showing the spatial distribution of aboveground carbon stocks across vegetated classes in the Thi Nai Lagoon area. The total aboveground carbon stock was estimated at more than 71,500 metric tons, demonstrating the potential of combining remote sensing data and machine learning for biomass monitoring, identifying areas of carbon accumulation and supporting lagoon ecosystem management.
Satellite imagery maps land cover across the lagoon landscape
Coastal ecosystems play an important role in the global carbon cycle. Mangroves, seagrass meadows and coastal wetlands can accumulate organic matter and store carbon in biomass and sediments. Understanding the distribution and magnitude of carbon stocks in these ecosystems is therefore important for climate change research, biodiversity conservation and coastal resource management.
However, the heterogeneous topography and land-cover characteristics of lagoon ecosystems present challenges for assessing biomass and carbon stocks over large areas. Conventional field surveys provide detailed information at specific measurement sites, but extending these findings across an entire landscape requires additional tools capable of spatial observation and analysis.
Thi Nai lagoon, a large coastal lagoon system in central Viet Nam, features a diverse landscape in which water bodies, mangroves, coastal vegetation belts, agricultural land, tidal flats and built-up areas are interspersed. These characteristics make the area suitable for investigating the application of remote sensing technologies to land use/land cover (LULC) classification and aboveground carbon stock estimation.
In their study, “Application of Google Earth Engine and GEDI data to estimate aboveground carbon stock in the Thi Nai lagoon area, Gia Lai province”, Vu Thi Hoai Thu, Dang Thi Kieu Oanh and Trieu Anh Ngoc developed an integrated spatial data-processing framework to characterize land cover and vegetation distribution within the study area. The analysis covered Thi Nai lagoon and its surrounding areas, with a total area of 200.64 km².
The 2024 LULC classification showed that water was the dominant class, covering 53.81 km², followed by annual crops at 44.78 km² and forest at 39.88 km². The remaining classes comprised built-up land, barren land and perennial crops. This distribution reflects the characteristics of a lagoon landscape in which natural ecosystems coexist with agricultural activities and settlements.
The classification model achieved an overall accuracy (OA) of 99.00% and a Kappa coefficient of 0.9877. These results indicate that the method effectively distinguished the major LULC classes in the study area, providing a baseline dataset for subsequent analyses of vegetation structure and biomass.
Combining spaceborne LiDAR and satellite imagery to estimate biomass
A key contribution of the study is its integration of GEDI data with Sentinel-2 satellite imagery on the Google Earth Engine (GEE) platform. This approach helps address the spatial discontinuity of vegetation-structure observations while extending biomass estimation across the broader landscape.
The Global Ecosystem Dynamics Investigation (GEDI) is a spaceborne LiDAR mission that provides information on vegetation structure, including tree canopy height (TCH) and aboveground biomass density (AGBD). These data are valuable for assessing the structural characteristics of vegetated areas. However, GEDI observations are distributed discontinuously across the Earth's surface.
Sentinel-2 imagery, meanwhile, provides optical observations over large areas, supporting the identification of land-cover characteristics and variations in vegetation conditions. When integrated with GEDI data, Sentinel-2 helps extend predictive estimates from individual observation locations to areas without direct measurements. Google Earth Engine facilitates the processing, harmonization and analysis of large volumes of remote sensing data within a unified computational environment.
The study integrated Sentinel-2 surface reflectance imagery, SRTM digital elevation model (DEM) data and GEDI L2A/L4A V002 data. The researchers used spectral bands, the Normalized Difference Vegetation Index (NDVI), Normalized Difference Water Index (NDWI) and Normalized Difference Built-up Index (NDBI), three principal components derived from principal component analysis (PCA), and two terrain variables as predictors. GEDI footprints were quality-filtered and harmonized with Sentinel-2 data before model development.
The researchers developed models to predict TCH and AGBD and compared four machine learning algorithms: Random Forest (RF), Classification and Regression Trees (CART), Gradient Boosting Trees (GBT) and Support Vector Machine (SVM). The comparison aimed to identify the model best suited to the characteristics of the lagoon landscape.
RF outperformed the other three algorithms. It achieved a root mean square error (RMSE) of 3.82 m for TCH and 7.77 Mg ha⁻¹ for AGBD, with corresponding coefficients of determination (R²) of 0.62 and 0.64, respectively.
The selection of RF was based on its prediction performance and suitability for a landscape characterized by a mosaic of different land-cover types. The algorithm can capture nonlinear relationships among spectral information, topography and vegetation structure, thereby supporting the spatial extrapolation of GEDI biomass observations into maps.
The strength of this approach lies in the complementary capabilities of the different data sources. GEDI provides reference information on canopy structure and biomass, Sentinel-2 extends spatial coverage, and GEE supports data processing and integration. Together, these resources provide a basis for monitoring biomass and aboveground carbon stocks in complex landscapes such as Thi Nai Lagoon.
Vegetation belts show higher aboveground carbon densities
Using the selected RF model, the researchers generated maps of aboveground carbon density and total aboveground carbon stocks across the vegetated classes in the Thi Nai Lagoon area.
The estimated total aboveground carbon stock of the vegetated classes reached 71,583.47 Mg C, equivalent to more than 71,500 metric tons of carbon. The mean carbon density was 7.46 Mg C ha⁻¹ across the vegetated classes included in the analysis.
Beyond providing an aggregate estimate, the maps revealed spatial differences in carbon storage across the lagoon landscape. Areas with higher carbon values were concentrated mainly along vegetation belts around the lagoon, in areas with substantial woody vegetation cover, and within core mangrove areas. By contrast, water, barren land and built-up land made negligible contributions to the estimated aboveground carbon stock.
This distribution indicates that aboveground biomass and carbon stocks are not uniform across the landscape but are closely associated with land-cover characteristics and vegetation structure. Areas with well-developed woody vegetation and greater vegetation cover tend to store more carbon than surfaces with sparse or no vegetation.
An important consideration when interpreting these results is that the mean value of 7.46 Mg C ha⁻¹ represents the vegetated classes across the study landscape, rather than the carbon density of mangroves alone. Thi Nai Lagoon has a mosaic landscape comprising water bodies, tidal flats, agricultural land and discontinuous vegetation belts. The findings should therefore be interpreted in the context of the broader lagoon landscape rather than applied directly to any single ecosystem type.
Furthermore, the study focused specifically on carbon stored in aboveground biomass. The researchers converted aboveground biomass to carbon using a factor of 0.47, following the IPCC default value. Belowground carbon and carbon stored in soils and sediments were not included in the calculations.
Representing the results in spatial maps at a resolution of 10 × 10 m provides additional value. Rather than reporting only a single estimate of total carbon stock for the entire study area, the maps make it possible to identify locations with higher levels of carbon accumulation and examine their spatial distribution. This information can support further ecological research, vegetation-change monitoring and the identification of areas warranting attention in lagoon ecosystem management.
A spatial basis for coastal ecosystem monitoring
The value of this study extends beyond estimating carbon stocks in Thi Nai Lagoon. It also demonstrates the potential of integrating remote sensing data and machine learning for resource and environmental monitoring over large spatial areas.
For coastal ecosystems, understanding the distribution of vegetation and biomass is an important basis for assessing current conditions, monitoring changes and supporting conservation and restoration planning. Given the frequent coexistence of natural ecosystems, production activities and infrastructure development in coastal areas, LULC and carbon maps can provide an additional spatial perspective for environmental assessment and management.
By integrating GEDI, Sentinel-2 and Google Earth Engine, the study demonstrates the potential to extend biomass observations from individual GEDI footprints into spatially distributed information across an entire landscape. This approach could be applied in other coastal areas with diverse land-cover characteristics, particularly lagoons, estuaries and coastal zones where vegetation is unevenly distributed.
For management purposes, aboveground carbon maps can help identify areas with notable carbon storage potential and provide reference information for vegetation monitoring and the development of ecosystem conservation and restoration measures. When updated using time-series data, the approach could also support the monitoring of changes in land cover, canopy structure and biomass over time.
Further improvements in the reliability of the results will require additional field-based biomass measurements and independent validation data. Field measurements would enable comparisons with model predictions, assessments of model performance across different habitats and more comprehensive quantification of uncertainties associated with data integration. Extending the analysis to belowground carbon and carbon stored in soils and sediments would also provide a more complete understanding of the carbon storage capacity of lagoon ecosystems.
As an output of national science and technology project KC.09.06/21-30, which focuses on the scientific basis and solutions for the protection, restoration and sustainable development of blue carbon ecosystems along the South Central Coast, the study contributes an additional approach to applying digital technologies in coastal resource and environmental research. The findings from Thi Nai Lagoon demonstrate that integrating multi-source remote sensing data with machine learning can generate valuable spatial information for monitoring biomass and aboveground carbon stocks. They also offer prospects for further developing tools to support the management and conservation of coastal ecosystems in Viet Nam.
Sources: This article is based on the study Application of Google Earth Engine and GEDI data to estimate aboveground carbon stock in the Thi Nai lagoon area, Gia Lai province” by Vu Thi Hoai Thu, Dang Thi Kieu Oanh and Trieu Anh Ngoc, published in the Science Journal of Agriculture and Environment, Issue 2, August 2026.
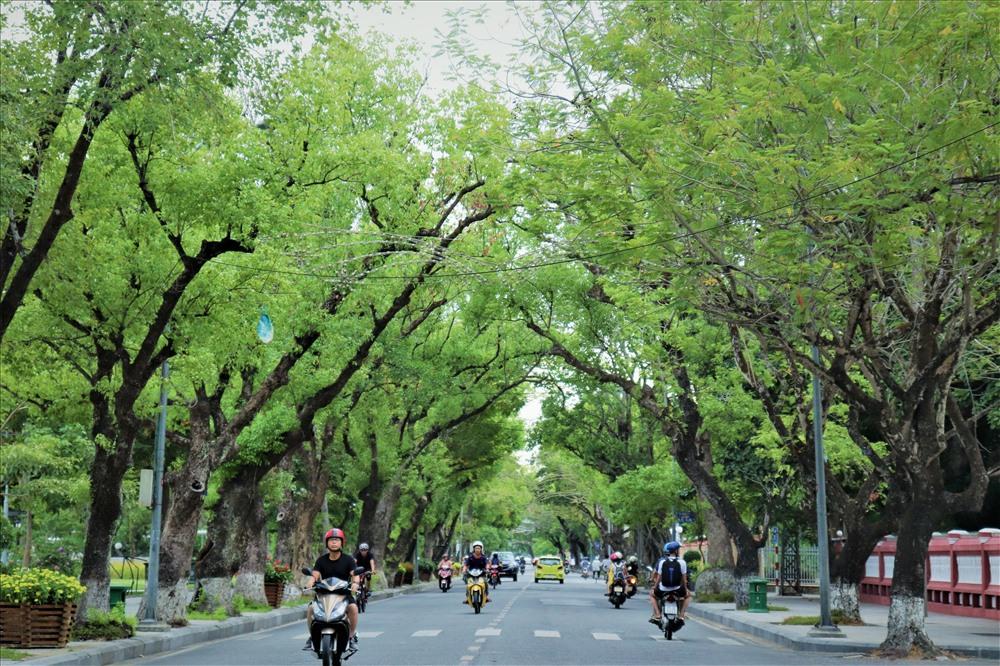
Urban green space plays an important role in improving environmental quality and supporting sustainable urban development. A study by Nguyen Ngoc Thanh, Nguyen Duy Phong, Tran Thi Thuy Huong and Pham Quoc Trung employed a hierarchical classification method based on Normalized Difference Vegetation Index (NDVI) thresholds derived from Sentinel-2A satellite data to identify urban green spaces in Hue City Center. A dataset comprising 100 ground-truth points was used to validate the classification maps.
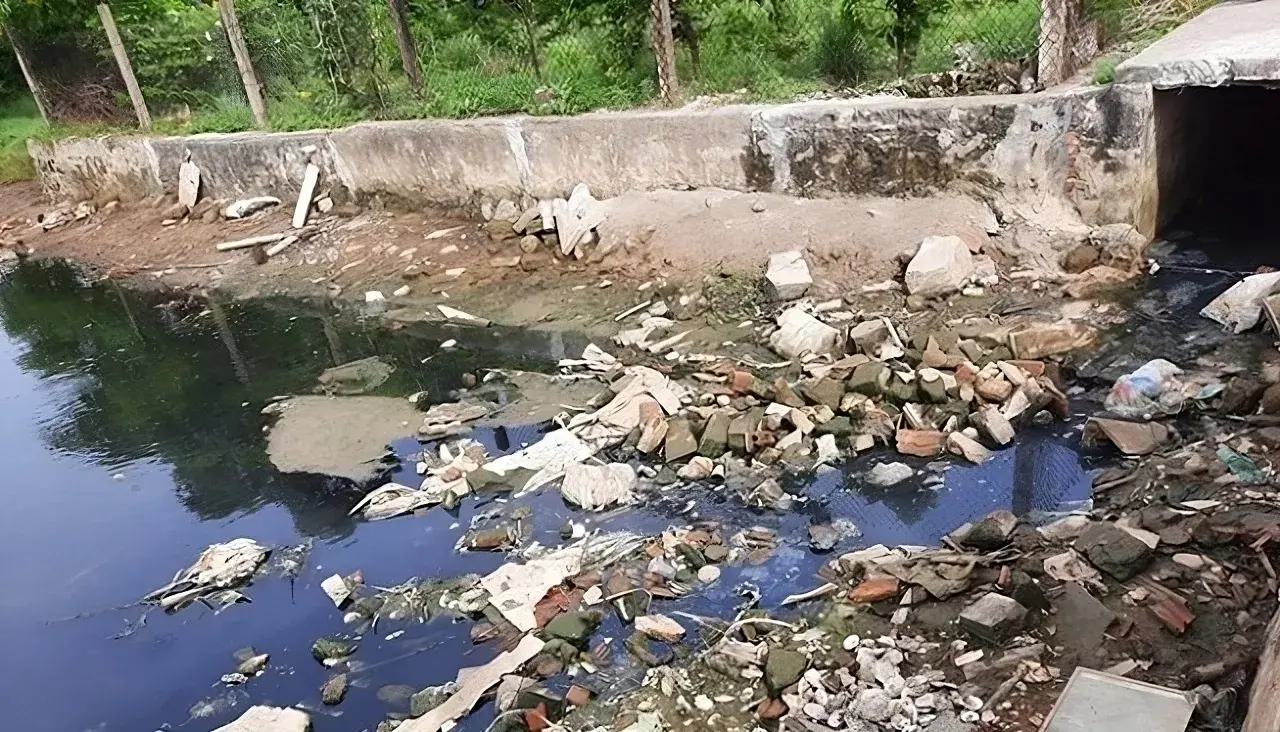
The application of low-frequency ultrasound irradiation to domestic wastewater has demonstrated its potential to reduce organic matter and microbial counts in experimental samples, according to a study by Hoang Duc An, Huynh Thi Minh Thanh, and Vo Thi Hong Phuong of the Faculty of Natural Sciences, Quy Nhon University. The findings also indicate that treatment performance depends on operating conditions and influent wastewater quality, suggesting that ultrasound could serve as a supplementary step in wastewater treatment processes.
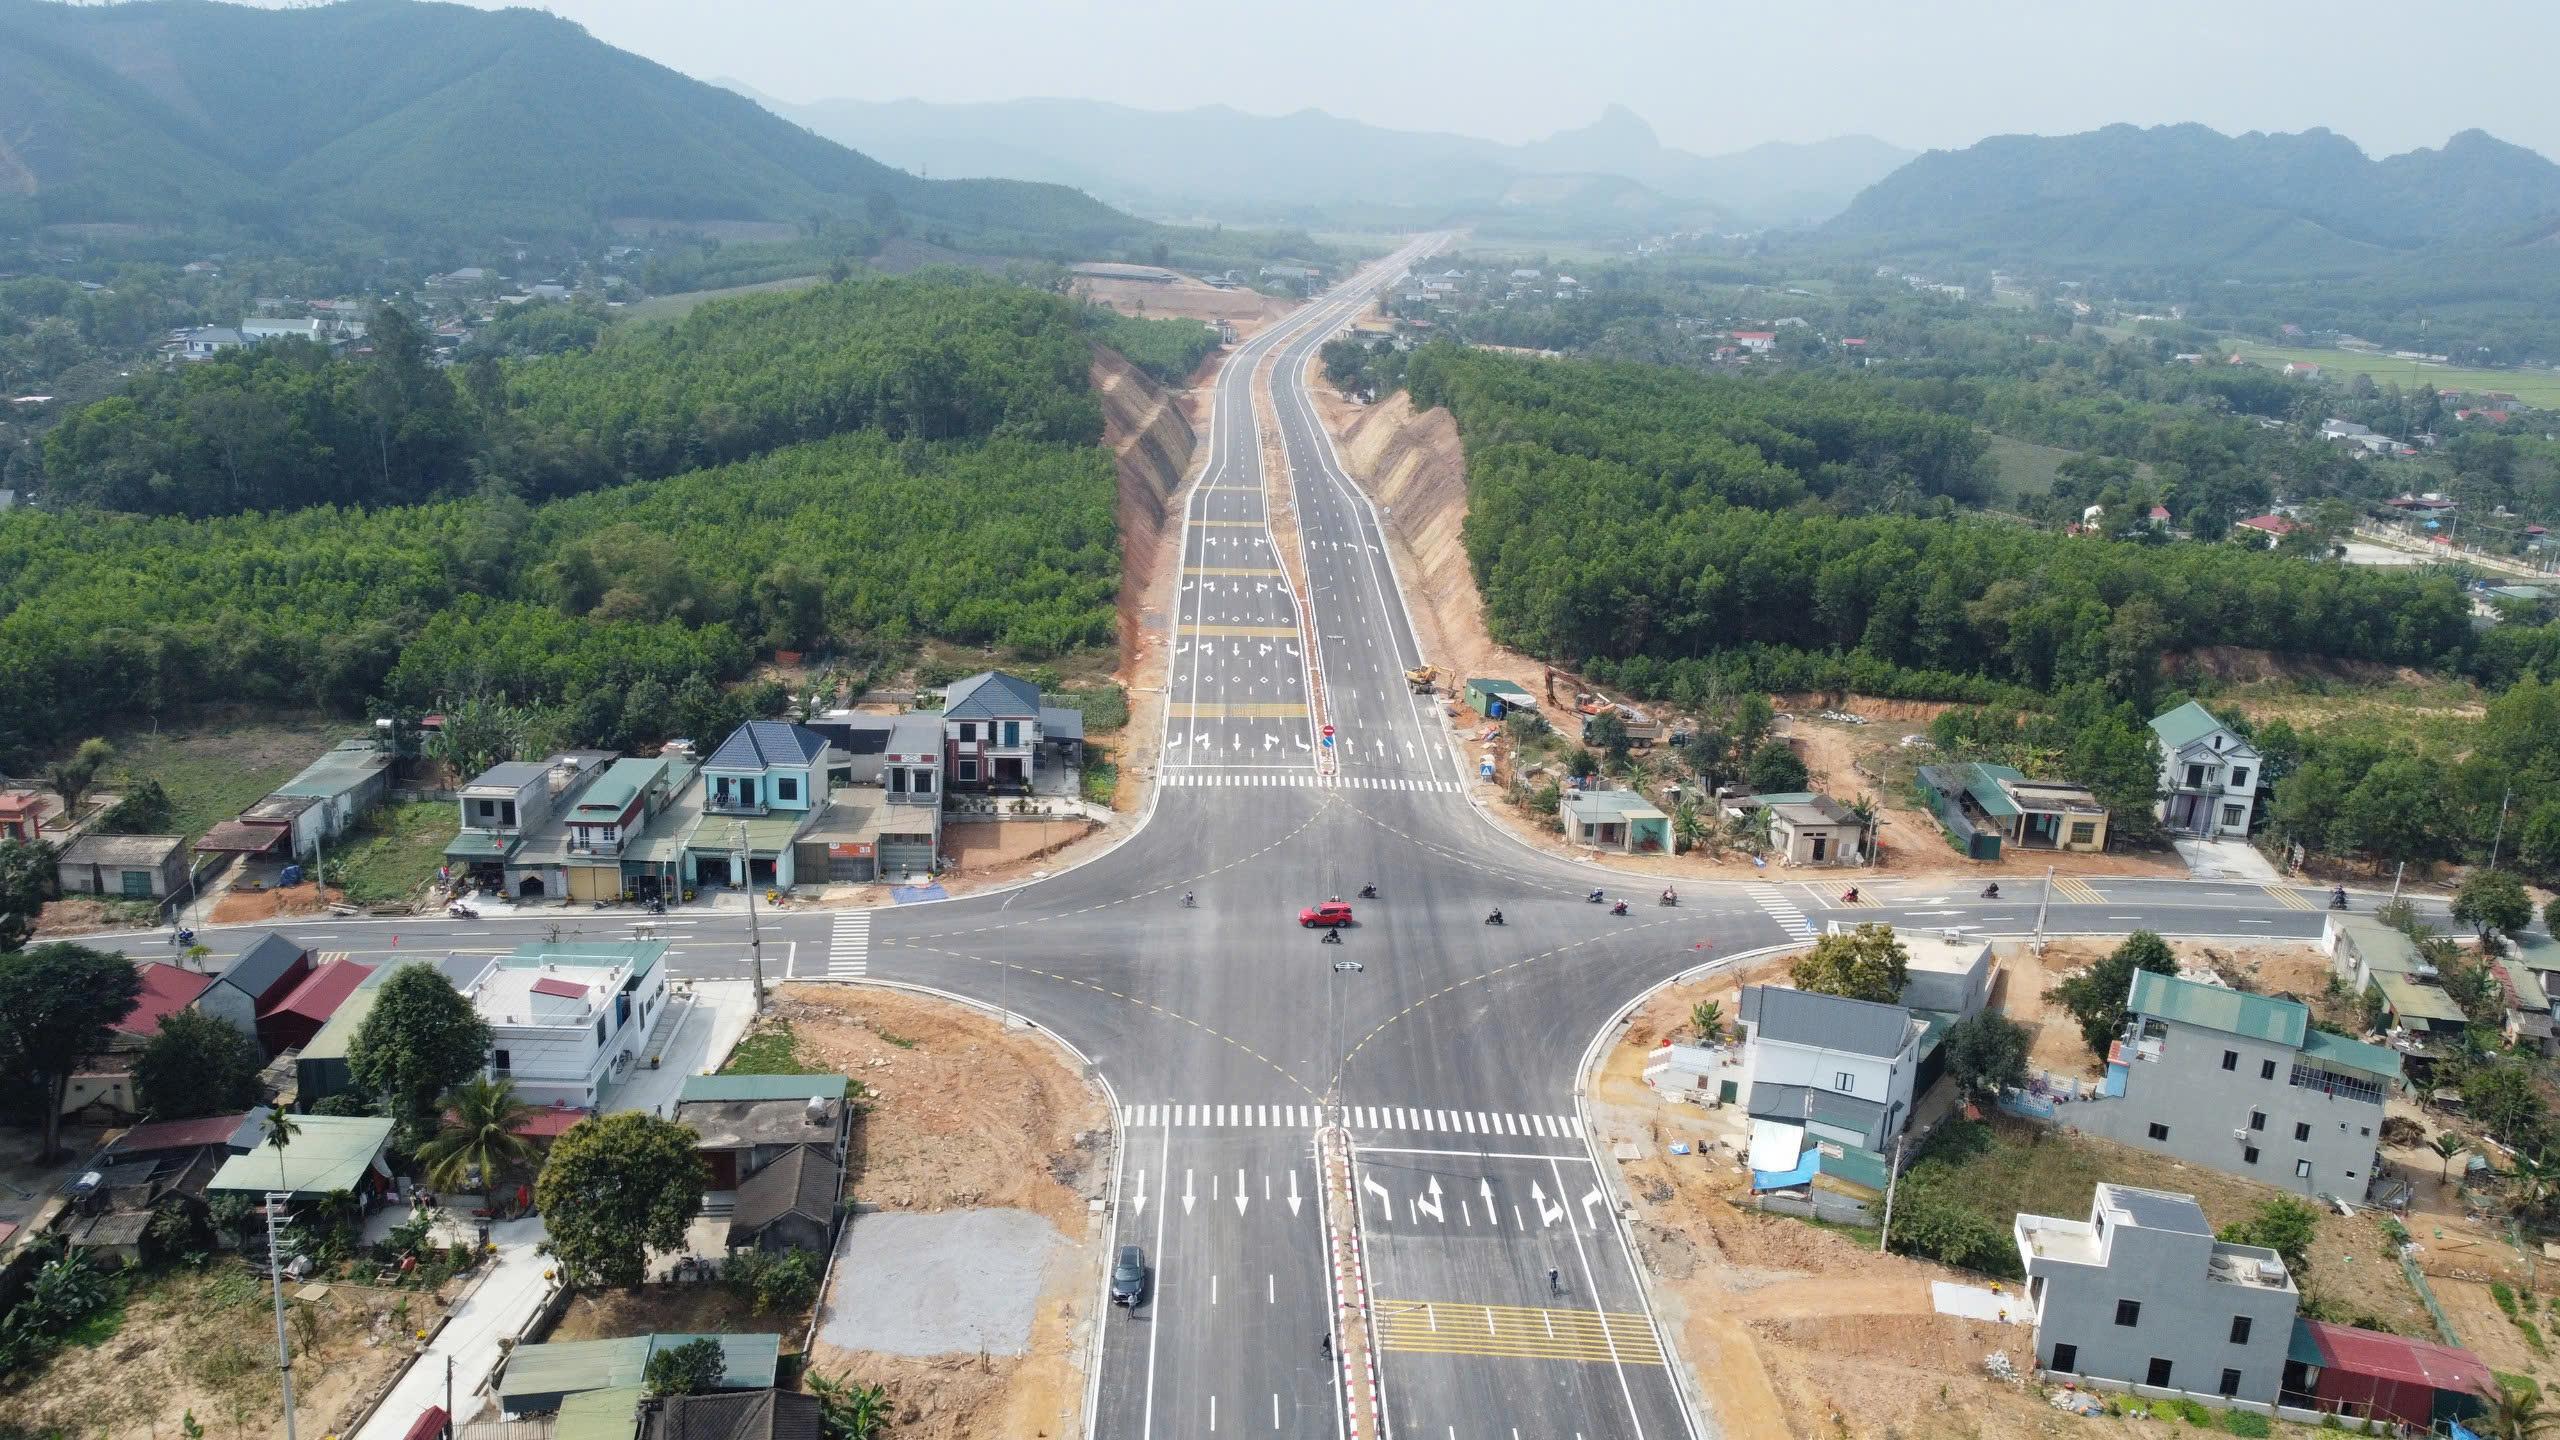
A study by Tran Thanh Son and colleagues on the Ben En–Ben Sung town center road project, in what is now Nhu Thanh commune, Thanh Hoa province, Viet Nam, demonstrates that integrating unmanned aerial vehicle (UAV) photogrammetry with MicroStation V8i can produce a land-use status map that meets the accuracy requirements for large-scale mapping. The results provide detailed geospatial data and identify 136,032.6 m² of land within the project’s acquisition boundary, supporting land inventory and the preparation of compensation, assistance, and resettlement plans.
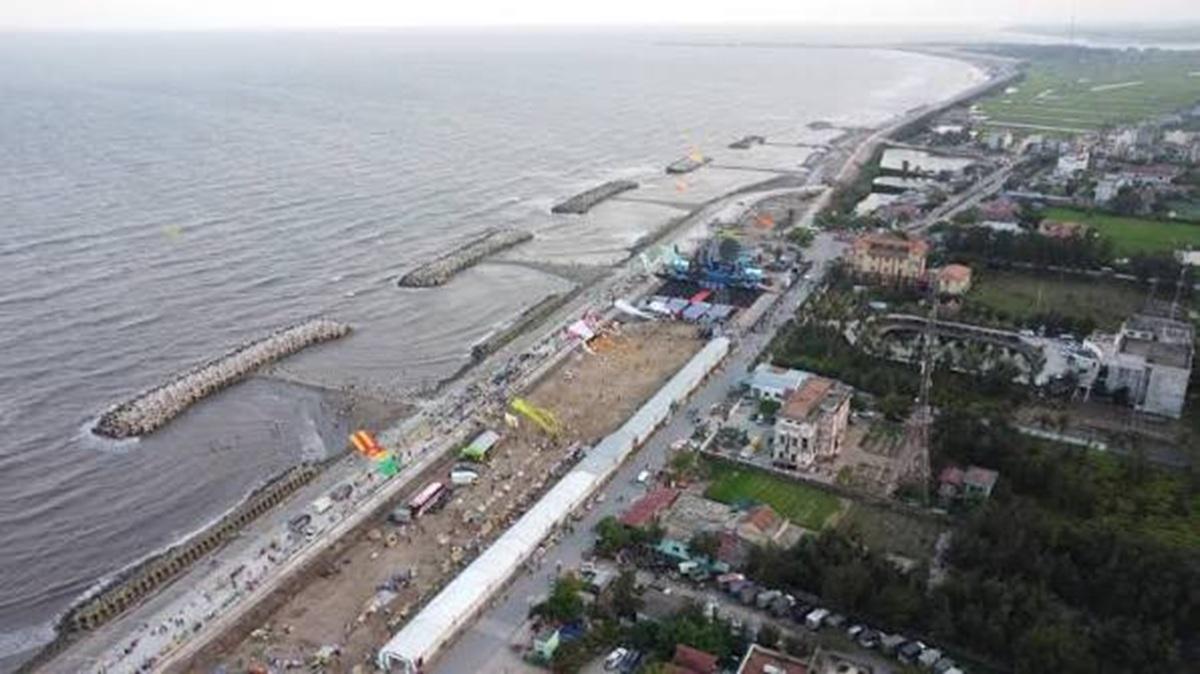
Producing cadastral extract maps in extensive aquaculture areas requires data acquisition methods that are both efficient and accurate, including in locations with extensive water surfaces and limited physical accessibility. A study by Phan Van Khue and Nguyen Duc Loc in Ninh Binh province, Viet Nam, shows that unmanned aerial vehicle (UAV) technology, combined with global navigation satellite system/real-time kinematic (GNSS/RTK) positioning and field verification, can meet the requirements for large-scale cadastral mapping, improve surveying efficiency, and provide data to support land administration.
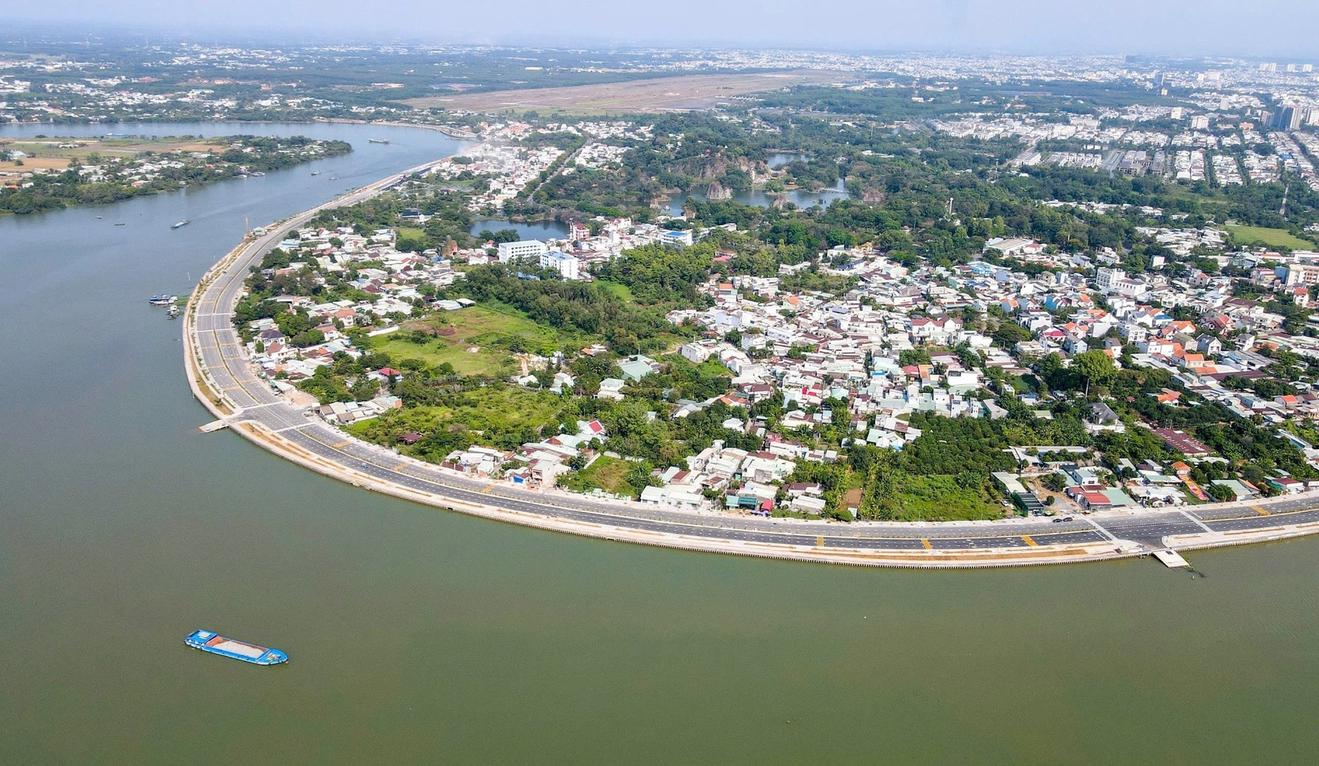
By integrating Landsat 8 satellite imagery with the NDVI, LST, and VTCI indices on the Google Earth Engine platform, researchers from the Southern Institute of Water Resources Planning have developed an agricultural drought-zoning map for the Dong Nai River Basin for 2014–2024. Comparisons with reference drought indices and field survey findings suggest that the approach has potential for identifying drought-prone areas, particularly agricultural areas outside the service areas of irrigation infrastructure.