




 Against the backdrop of climate change and rapid urbanization, land surface temperature (LST) in major cities tends to increase, thereby intensifying the urban heat island (UHI) effect. A study by Tran Van Trong, Nguyen Huy Anh, Tran Phuong Binh, and Bach Van Luong of Ho Chi Minh City University of Natural Resources and Environment aims to develop a workflow for monitoring and assessing LST variation in Ho Chi Minh City during 2020–2025 through the integration of remote sensing data and geographic information systems (GIS).
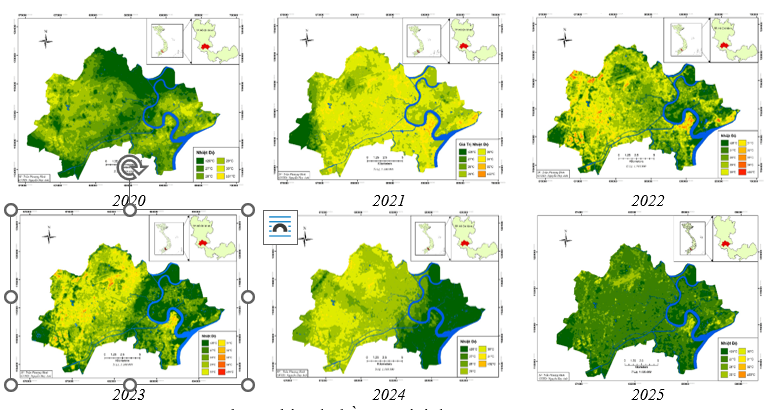
The role of LST monitoring in understanding urban thermal conditions
Monitoring changes in land surface temperature (LST) plays a central role in contemporary urban environmental monitoring and management. LST is an important quantitative parameter for assessing and mapping the spatial distribution of the urban heat island (UHI) effect, helping identify microclimatic hotspots. Monitoring changes in LST also helps clarify the complex relationship between surface temperature and land-cover characteristics, particularly the decline in vegetation cover and the increase in heat-absorbing artificial surfaces. From a planning perspective, surface-temperature data provide a scientific basis for developing adaptation scenarios, including the spatial allocation of green spaces, water bodies for thermal regulation, and ventilation corridors to mitigate the urban heat island effect.
LST monitoring also supports early warning of public health risks associated with heat waves and provides input data for models assessing the impacts of localized climate change.
Compared with air-temperature measurements from meteorological stations, LST offers greater spatial continuity because thermal remote sensing can provide spatially continuous observations, particularly in large cities characterized by heterogeneous surface structures.
Urban LST monitoring has focused primarily on several key areas: tracking UHI dynamics using thermal remote-sensing imagery; analyzing relationships between LST and land cover, urban morphology, and green spaces; and developing techniques to improve the spatial and temporal resolution of LST data to support more detailed assessments at the intra-urban scale.
Globally, recent LST research has relied primarily on thermal imagery from Landsat, MODIS, Sentinel-3, and ECOSTRESS, together with techniques that integrate data from multiple sources. Landsat remains widely used because of its long-term data record and spatial resolution suitable for urban studies, while MODIS and geostationary sensors support analyses across diurnal and seasonal cycles. One prominent area of development is improving the spatial resolution of LST to address the trade-off between the spatial and temporal resolution of thermal sensors.
Alongside these developments, the Local Climate Zones (LCZ) classification framework has been increasingly used in urban LST research. A review by Aslam and Rana indicates that LCZ has become an important framework for linking surface temperature with urban morphology, building density, surface materials, and climate-adaptation capacity. The WUDAPT approach and Landsat data are also widely used because of their open accessibility and applicability across different cities.
In Viet Nam, urban LST research has generally developed through the application of remote sensing and GIS to assess the impacts of urbanization on UHI in major cities such as Hanoi, Da Nang, Can Tho, and Ho Chi Minh City. These studies generally converge on the finding that built-up surfaces, bare land, and industrial areas tend to have high LST, whereas water bodies and vegetation have a clear cooling effect. However, compared with international research trends, studies in Viet Nam still rely largely on single-date Landsat imagery or discontinuous time series, while studies that simultaneously use daytime and nighttime data, geostationary data, or the LCZ framework remain limited.
Ho Chi Minh City is a particularly representative study area because of its rapid urbanization, extensive expansion of impervious surfaces, and strong contrasts among the central urban area, peri-urban zones, river and canal corridors, and the Can Gio mangrove ecosystem. Several studies using Landsat data have shown that urbanization has a clear influence on surface temperature and UHI distribution in the city. The area of impervious surfaces has increased substantially, accompanied by a rise in maximum LST from 31.2°C to 42.3°C. At the same time, vegetation has been identified as the most effective component in reducing LST, while impervious surfaces have been the strongest contributor to increased surface temperatures. These findings provide quantitative evidence of the relationship between land-cover conversion and increasing surface temperatures in a rapidly developing tropical city.
Within Viet Nam, Ho Chi Minh City is particularly significant because it is a tropical coastal megacity where urbanization, building density, an extensive river and canal network, and distinctive ecosystems coexist within a highly complex spatial environment. Compared with Hanoi and Da Nang, research in Ho Chi Minh City not only reflects warming associated with the expansion of built-up surfaces but also highlights the important role of vegetation, water bodies, and mangrove areas in regulating thermal conditions. This makes the city a representative case for analyzing the relationship between urban morphology, land cover, and thermal structure in a tropical monsoon urban environment.
This review indicates that urban LST assessment is no longer merely a technical remote-sensing task but has also become an important tool for urban heat management, land-use planning, green-space planning, UHI mitigation, and strengthening climate resilience. In this context, LST research in Ho Chi Minh City has considerable scientific and practical significance, contributing evidence from a rapidly developing tropical city while providing a basis for climate-adaptive planning strategies at the urban and coastal-regional scales.
LST variation and urban thermal patterns in Ho Chi Minh city
The study uses Landsat 8 (Landsat Data Continuity Mission, LDCM) imagery covering central Ho Chi Minh City. The imagery was downloaded directly from the U.S. Geological Survey (USGS) website through EarthExplorer. The Landsat 8 data obtained from the USGS were processed at Level 1T, with terrain correction to account for topographic effects. The images were of good quality and had limited cloud contamination (cloud cover below 10%). The data use the UTM–WGS 84 coordinate system, Zone 48 North.
Landsat 8 is equipped with two primary instruments: the Operational Land Imager (OLI) and the Thermal Infrared Sensor (TIRS). Compared with previous generations of Landsat satellites, these instruments incorporate improvements designed to enhance data acquisition quality and the reliability of the Earth-observation system. Landsat 8 provides data across 11 spectral bands, including nine bands in the visible, near-infrared, and shortwave-infrared portions of the spectrum and two thermal infrared bands. The imagery provides a spatial resolution of 30 m for the visible, near-infrared, and shortwave-infrared bands; 100 m for the thermal bands; and 15 m for the panchromatic band. These characteristics make Landsat 8 suitable for studies of land surfaces, land-cover dynamics, and surface thermal characteristics using remote sensing.
The Landsat imagery used in the study covers the 2020–2025 period and is divided into two seasons: the rainy season, represented by imagery acquired in February and March, and the dry season, represented by imagery acquired from August to December.
The study applies an approach for estimating land surface emissivity based on the normalized difference vegetation index (NDVI) as the basis for calculating LST from Landsat 8 imagery in the study area. This approach better reflects differences in land-cover characteristics, thereby improving the consistency between calculated surface-temperature values and actual conditions. Atmospheric correction is also performed to minimize the effects of atmospheric factors on the radiance and spectral reflectance values of the remote-sensing imagery. These procedures improve the reliability of the derived surface-temperature values and their suitability for analyzing the spatial distribution of thermal conditions in the study area.
Based on calculated LST values for the dry and rainy seasons during 2020–2025 derived from Landsat satellite imagery, the study examines two aspects simultaneously: (i) differences in LST between the two seasons within each year; and (ii) annual temperature trends to identify variations in the intensity of the urban heat island effect in central Ho Chi Minh City. The data show clear seasonal variations in LST, together with distinct interannual patterns.
Analysis of satellite imagery for 2020–2025 indicates that 2022 was a representative year of an extreme warm phase, with more than half of the dry-season area recording temperatures of 33°C or higher. By contrast, in 2025, overall thermal conditions declined substantially and relatively cooler areas expanded. This indicates that LST variability is influenced not only by long-term urbanization but also responds strongly to interannual climate variability.
From a planning perspective, the findings demonstrate the role of vegetation, water bodies, river and canal corridors, and surfaces with greater heat-reflective or heat-dissipation capacity in reducing surface temperatures. The increase in the proportion of areas with temperatures of ≤26°C in some recent years, particularly during both the rainy and dry seasons of 2025, indicates potential for expanding heat-regulating spaces within the urban area. Conversely, periods of intense dry-season heat in densely built-up areas with limited vegetation and extensive impervious surfaces remain particularly vulnerable to urban thermal stress.
Overall, the study indicates that surface temperature in central Ho Chi Minh City exhibits a pronounced seasonal pattern, with the dry season showing the strongest expression of the urban heat island effect. The 2020–2025 series shows that extreme warm phases can emerge in individual years, most notably in 2022, while the latter part of the study period shows a tendency toward lower surface temperatures. Controlling the expansion of impervious surfaces, increasing green cover, and maintaining water spaces should therefore be considered key directions for mitigating the surface urban heat island effect in the central urban area.
Source: This article is based on the study “Monitoring land surface temperature changes in Ho Chi Minh city using remote sensing data” by Tran Van Trong, Nguyen Huy Anh, Tran Phuong Binh, and Bach Van Luong of Ho Chi Minh City University of Natural Resources and Environment, published in the Proceedings of the 4th National Conference on Land Management – 2026.

The research project entitled “Development of a suitability map for Arabica coffee cultivation on sloping land in Dien Bien province using remote sensing data, GIS technology, and the analytic hierarchy process (AHP)” conducted by Dinh Xuan Hung, Bui Tuan Hai, and Nguyen Ngoc Sang of the Institute of Water Resources Planning represents a scientifically and practically significant study in the context of ongoing agricultural restructuring toward sustainable production systems that are better adapted to natural conditions and capable of utilizing land resources more efficiently in Viet Nam’s Northern midlands and mountainous region.

Intensive shrimp farming generates substantial economic benefits but also exerts increasing pressure on aquatic environments, particularly through wastewater rich in organic matter and toxic byproducts generated during farming operations. In the context where many shrimp farms still lack appropriate wastewater treatment systems, a research team from Can Tho University and Toan Viet Technological Environment Company Limited conducted an experimental study to assess the potential use of fishing nets—a readily available, low-cost material—as a filter material for biological treatment of wastewater from intensive shrimp ponds.
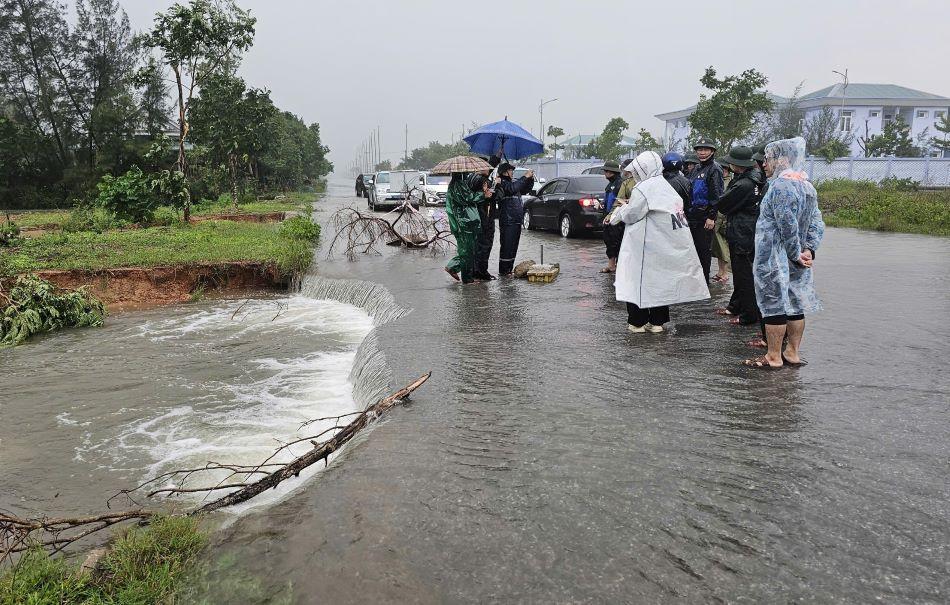
As floods become increasingly complex and extreme in Viet Nam’s North Central region, the demand for an early warning system that is reliable, fast to operate, and suitable for local-level application has become more urgent than ever. A research team from the Vietnam Academy for Water Resources—including Nguyen Thanh Hung, Vu Dinh Cuong, Trieu Quang Quan, and Nguyen Anh Hung—has developed an integrated technological solution that combines flood and inundation forecasting with modern communication tools. The study aims not only to enhance forecasting capacity but also to ensure that warning information reaches the right people at the right time under emergency flood conditions.

The use of pesticides is an integral part of modern intensive agriculture. Alongside their effectiveness in controlling pests and diseases, however, comes the risk of environmental pollution from wastewater generated during the production, formulation, and application of chemical active ingredients. Of particular concern is the fact that many pesticide compounds are poorly biodegradable, persistent in the environment, and prone to bioaccumulation, posing major challenges for wastewater treatment.
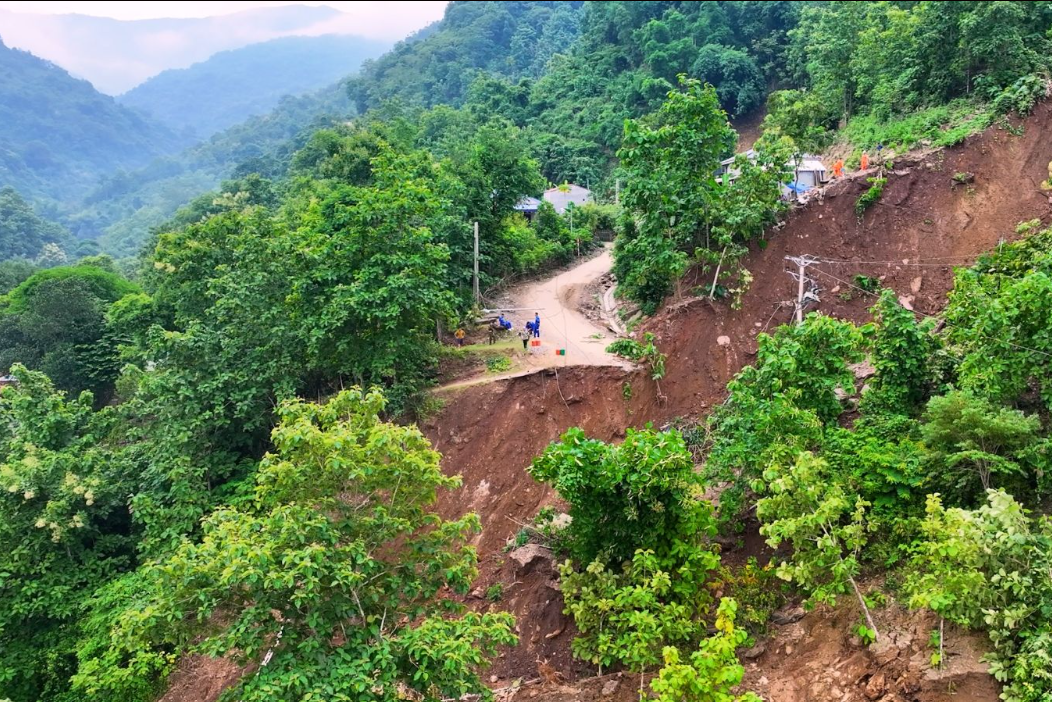
Steep terrain, concentrated heavy rainfall, and the increasingly evident impacts of climate change are placing Son La province’s land resources under growing pressure from soil erosion. By applying Geographic Information Systems (GIS) and the Revised Universal Soil Loss Equation (RUSLE), a research team comprising Tran Xuan Bien, Nguyen Van Huong, Luu Thuy Duong, and Tran Xuan Mien from the Hanoi University of Natural Resources and Environment and the Hanoi University of Mining and Geology has conducted a comprehensive study to assess the extent, severity, and spatial distribution of rainfall-induced soil erosion across the province. The findings offer an important scientific basis for land resource management and the formulation of sustainable development solutions in Son La.