



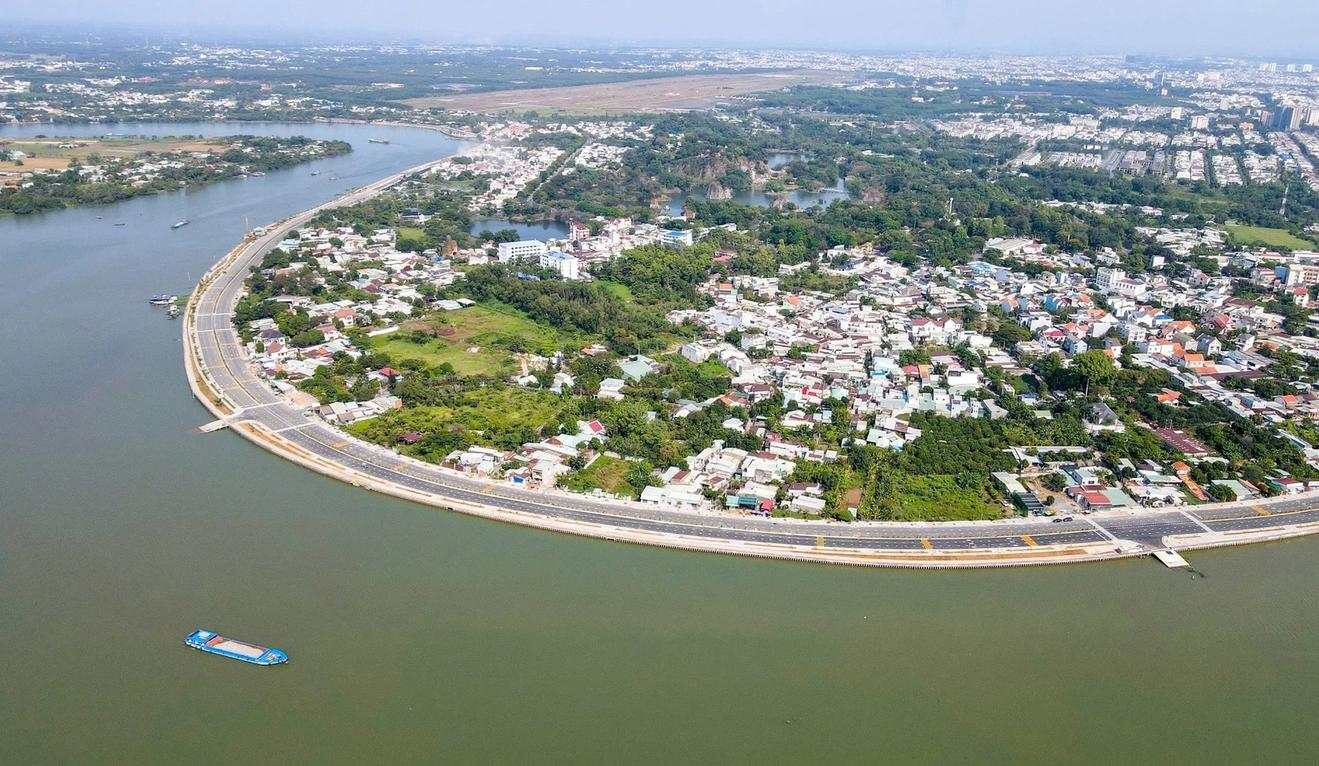
 By integrating Landsat 8 satellite imagery with the NDVI, LST, and VTCI indices on the Google Earth Engine platform, researchers from the Southern Institute of Water Resources Planning have developed an agricultural drought-zoning map for the Dong Nai River Basin for 2014–2024. Comparisons with reference drought indices and field survey findings suggest that the approach has potential for identifying drought-prone areas, particularly agricultural areas outside the service areas of irrigation infrastructure.
Satellite data track vegetation and thermal stress
Agricultural drought poses challenges to agricultural production and water resources management in the Dong Nai River Basin, where water shortages frequently occur during the dry season. Identifying drought-prone areas, monitoring changes over time, and providing information to support water management are particularly important for agricultural areas that do not directly benefit from irrigation infrastructure.
Remote sensing offers a means of monitoring land surface conditions over large areas, supplementing existing drought monitoring efforts. However, analyzing multiyear satellite image series requires consistent processing procedures and adequate computational capacity. Google Earth Engine (GEE), a cloud-based platform for accessing and processing large volumes of data, facilitates remote sensing analysis without complete reliance on local computing infrastructure.
In their study, Nguyen Vu Huy, Truong Ngoc Chinh, Nguyen Huu Chi, and Nguyen Lan of the Southern Institute of Water Resources Planning used Landsat 8 Collection 2 Level-1 (top-of-atmosphere, or TOA) imagery in combination with GEE to analyze agricultural drought in the Dong Nai River Basin over the 2014–2024 period. The study focused on agricultural production areas outside the service areas of irrigation infrastructure, with the aim of developing drought-zoning maps and identifying areas vulnerable to water shortages.
Three indices were used: the Normalized Difference Vegetation Index (NDVI), land surface temperature (LST), and Vegetation Temperature Condition Index (VTCI). NDVI reflects vegetation conditions based on spectral reflectance characteristics, while LST provides information on the thermal conditions of the land surface. VTCI is derived from the relationship between NDVI and LST and is used to assess drought severity and vegetation water stress.
The research team processed Landsat 8 imagery acquired during the dry season each year, screening the data before calculating the indices. Notably, the method dynamically determined the hot and cold edges of the NDVI–LST feature space for each Landsat scene rather than relying on absolute maximum and minimum values. Percentile thresholds were applied to reduce the influence of anomalous pixels, helping stabilize VTCI calculations across observation dates.
This approach provided a consistent analytical framework for the 11-year dataset and enabled the researchers to examine both the spatial distribution and temporal dynamics of agricultural drought.
VTCI reveals spatial and seasonal drought patterns
The analysis for 2014–2024 showed that the remote sensing indices captured variations in thermal and moisture conditions and vegetation status across the Dong Nai River Basin. These variations corresponded with El Niño and La Niña phases during the study period.
NDVI declined during major El Niño periods, including 2015–2016, 2019–2020, and 2023–2024. By contrast, the index tended to recover during the La Niña periods of 2017–2018 and 2021–2022. These patterns indicate that vegetation responses can provide useful information for identifying periods when growing conditions are affected by drought.
The LST maps also revealed clear spatial differences. Mean LST values above 35°C during the study period were concentrated primarily in areas with sparse vegetation cover and extensive bare land. In contrast, mean LST values below 27°C were observed in upstream forest areas and around Tri An Reservoir. These differences reflect the relationship between land cover characteristics and surface thermal conditions, while also providing input data for VTCI calculations.
By combining NDVI and LST, the VTCI maps distinguish different levels of drought severity across the study area. Under the classification thresholds used in the study, VTCI values below 0.4 indicate severe water stress, while values above 0.8 correspond to more favorable moisture conditions.
VTCI variations showed that drought conditions differed across both space and time. The index declined markedly during 2014–2016, particularly in 2015–2016. Moisture conditions recovered during 2017–2019, although the recovery was uneven across the basin. From 2020 through 2024, drought conditions became pronounced again, particularly in 2020 and 2024. Although moisture conditions improved during the La Niña phase of 2021–2022, recovery remained uneven in coastal areas of Vietnam's south-central region.
The resulting drought-zoning maps help identify areas requiring closer attention during the dry season. In particular, the focus on agricultural production areas outside the service areas of irrigation infrastructure provides additional spatial information for identifying locations where water shortages warrant closer monitoring.
Field surveys support satellite-based assessments
To assess the agreement between the remote sensing results and field conditions, the research team conducted surveys at 116 sites across the basin from March 8 to 28, 2025. The surveys examined cultivation conditions, irrigation water availability, and observable signs of drought in areas identified as vulnerable to water shortages.
The results showed a high degree of agreement between VTCI-based drought classification and field observations. At sites with VTCI values below 0.4, the survey team recorded signs including irrigation water shortages, cracked soil, reduced vegetation cover, and scorched vegetation. These observations provided field evidence against which the satellite-derived results could be assessed.
In addition to the field surveys, the study used two reference indices—the Standardized Precipitation Evapotranspiration Index (SPEI) and the Vegetation Health Index (VHI)—to examine their relationships with VTCI. SPEI characterizes meteorological moisture deficits and surpluses, while VHI provides information on vegetation responses to changes in thermal conditions and vegetation growth.
Pearson correlation analysis found positive correlations between VTCI and VHI ((r = 0.68)) and between VTCI and SPEI ((r = 0.65)), with (p < 0.1) reported for both relationships. These coefficients indicate that VTCI variations corresponded with both meteorological conditions and vegetation health during the study period.
The agreement among the drought-zoning results, reference indices, and field observations provides further support for the assessment of the method. The findings suggest that integrating VTCI with GEE has potential for agricultural drought monitoring, particularly in areas where ground-based observations are limited or continuous monitoring data are unavailable.
Drought mapping for dry-season water management
The agricultural drought-zoning maps developed in this study can provide supplementary information for identifying areas at risk of water shortages, monitoring drought dynamics, and planning dry-season water management. Processing Landsat 8 image series through GEE helps maintain data consistency over multiple years while enabling analysis across the entire basin.
In agricultural areas outside the service areas of irrigation infrastructure, information on drought location and severity can help identify priority areas for monitoring, assess water requirements, and evaluate appropriate water supply options. However, remote sensing maps should be used alongside meteorological and hydrological information and field survey data to provide a more comprehensive basis for local management decisions.
The applicability of the method must also be considered in light of the limitations of the input data. Landsat 8's 16-day revisit interval may limit the detection of rapid changes, while clouds and atmospheric effects may cause data gaps or introduce errors in some areas. In addition, the NDVI–LST relationship may be less stable over bare land or in urban areas. These factors need to be considered when extending the method to areas with complex land cover characteristics.
To improve monitoring capabilities in future work, the researchers propose exploring the integration of Sentinel-2 imagery, ERA5 meteorological data, and machine learning models such as Random Forest and Gradient Boosting Decision Trees (GBDT). Another proposed application is an online dashboard on GEE to display NDVI, LST, VTCI, and SPEI values, support drought monitoring, and inform the development of warning tools. These are proposed directions for further development, rather than functions confirmed to be operational in the current study.
Overall, the study by Nguyen Vu Huy and his colleagues demonstrates the potential of combining remote sensing data with cloud computing to identify agricultural drought across a large river basin. The integration of NDVI, LST, and VTCI, together with comparisons against observations from 116 field survey sites, provides an additional scientific basis for monitoring areas vulnerable to water shortages. With further refinement and integration of field data, the approach could contribute to water supply planning, water resources management, and improved preparedness for agricultural drought in the Dong Nai River Basin.
Source: This article introduces the study “Application of Google Earth Engine for agricultural drought analysis using NDVI, LST and VTCI indices in the Dong Nai River Basin” by Nguyen Vu Huy, Truong Ngoc Chinh, Nguyen Huu Chi, and Nguyen Lan, published in Science Journal of Agriculture and Environment, Issues 3–4, February 2026.
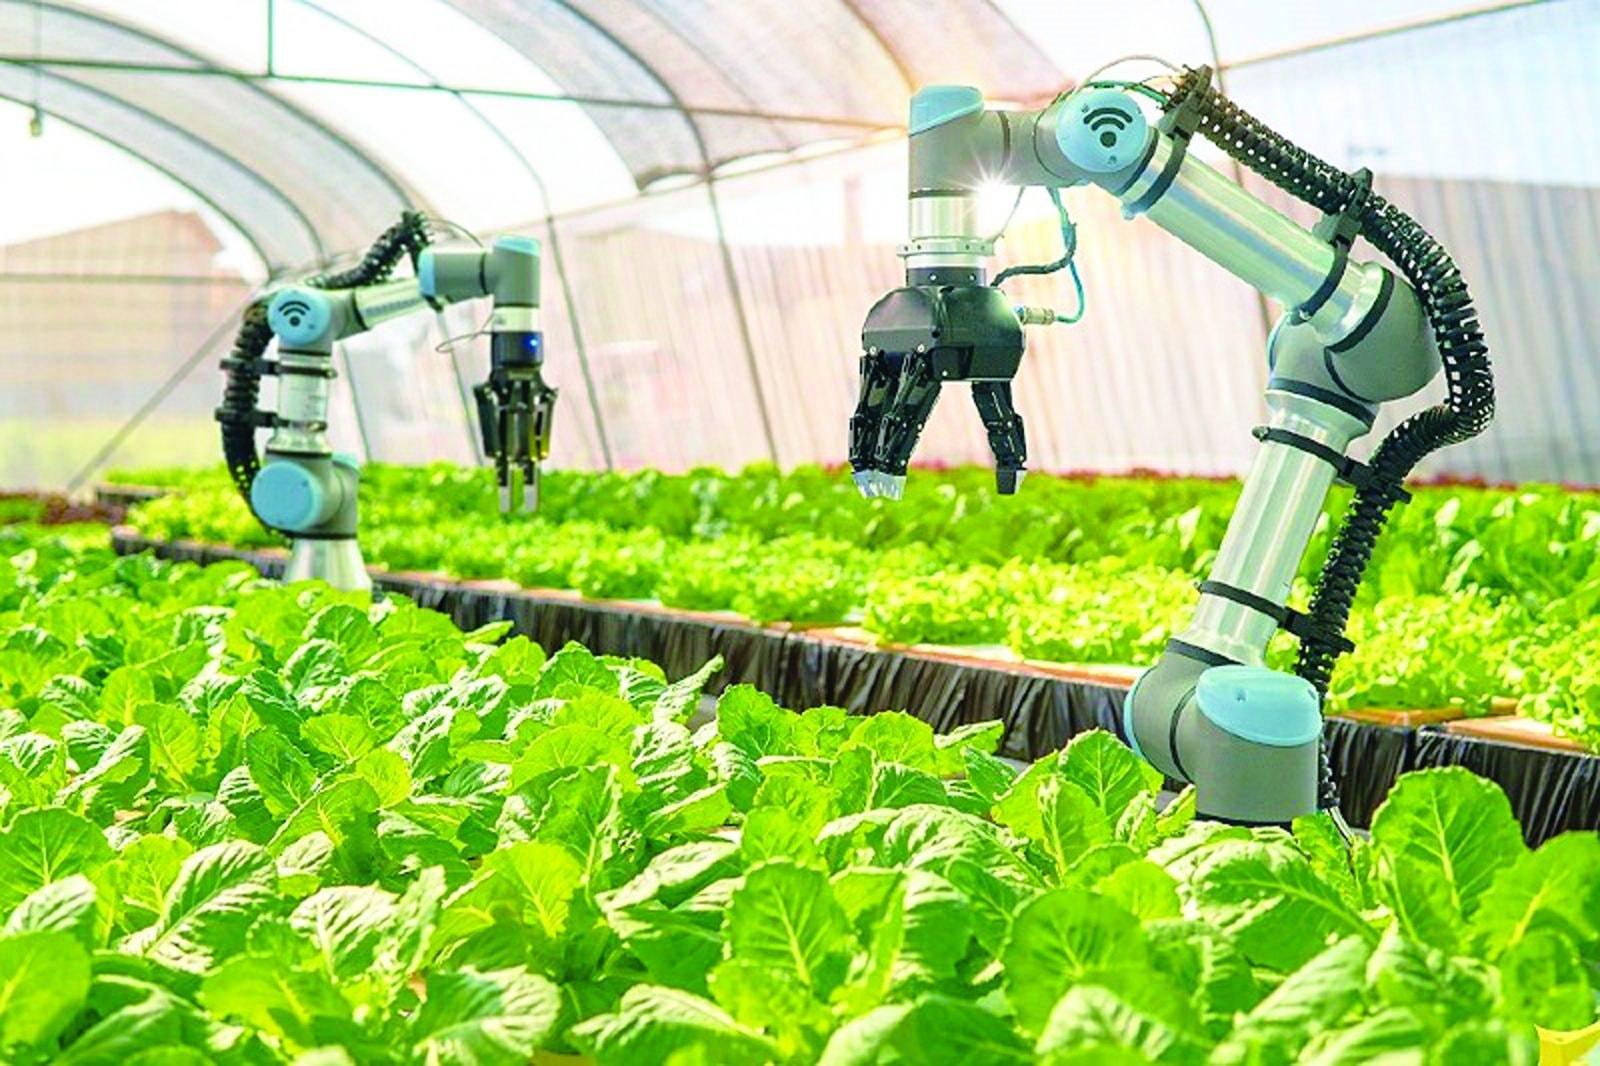
Selecting technologies suited to specific agroecological zones and producers’ capacity is an approach proposed by Nguyen Trong Tuan Anh, MSc, to strengthen agricultural resilience, improve resource-use efficiency, and advance green and circular production.
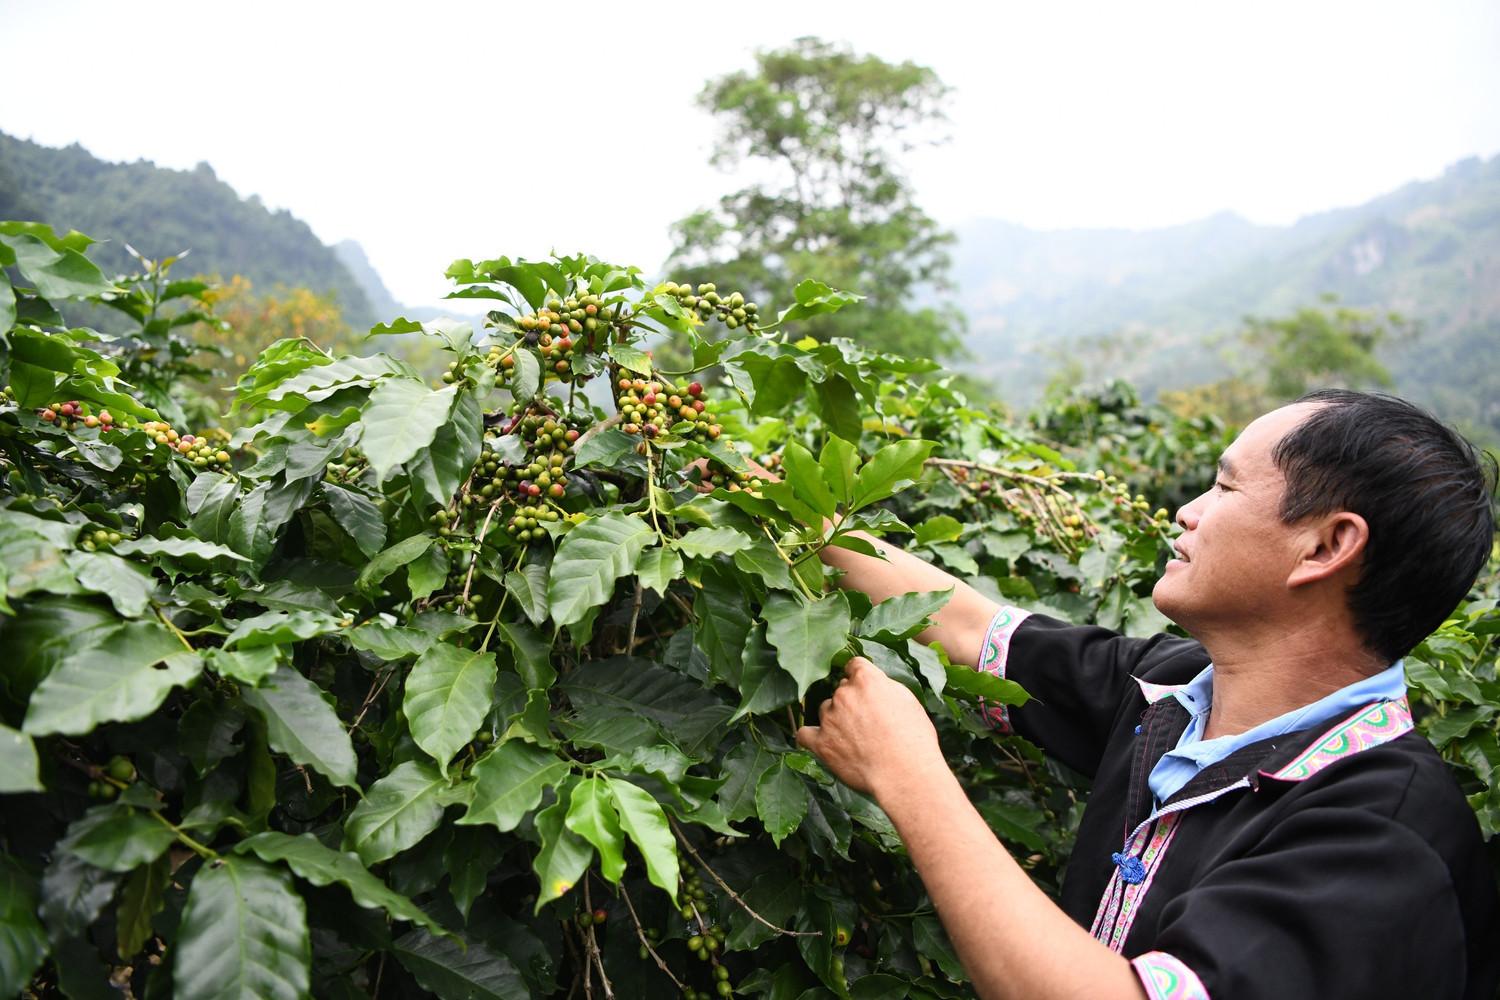
Using remote sensing data, geographic information systems (GIS), and the Analytic Hierarchy Process (AHP), Vietnamese scientists have developed a map of the potential for Arabica coffee cultivation on sloping land in Dien Bien Province. The findings identify areas with suitable natural conditions and provide a scientific basis for cultivation-zone planning, crop restructuring, and more efficient use of land and water resources in a mountainous province in northwestern Viet Nam.
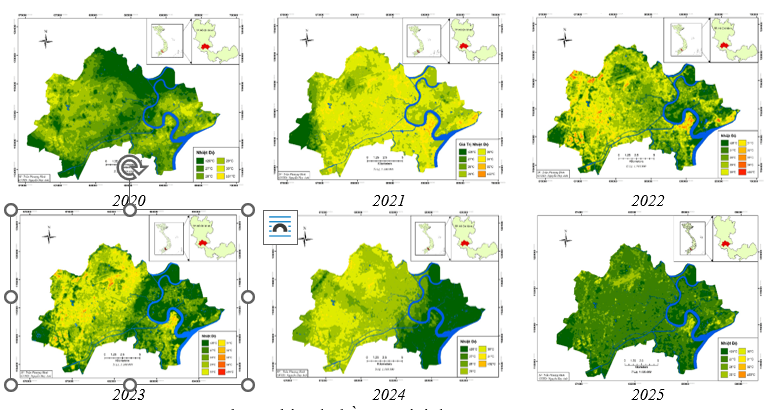
Against the backdrop of climate change and rapid urbanization, land surface temperature (LST) in major cities tends to increase, thereby intensifying the urban heat island (UHI) effect. A study by Tran Van Trong, Nguyen Huy Anh, Tran Phuong Binh, and Bach Van Luong of Ho Chi Minh City University of Natural Resources and Environment aims to develop a workflow for monitoring and assessing LST variation in Ho Chi Minh City during 2020–2025 through the integration of remote sensing data and geographic information systems (GIS).
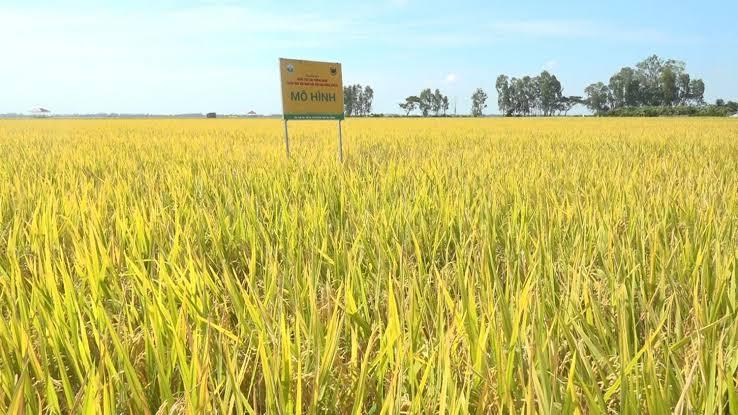
Whether rice paddy fields are inundated or dry produces distinct signatures in radar imagery. Building on this characteristic, researchers from the Southern Institute of Water Resources Research and the Vietnam National Space Center, Viet Nam Academy of Science and Technology, tested a method for detecting inundation in rice paddy fields in An Giang Province, providing an additional source of data for monitoring water regimes and estimating methane emissions from rice cultivation.
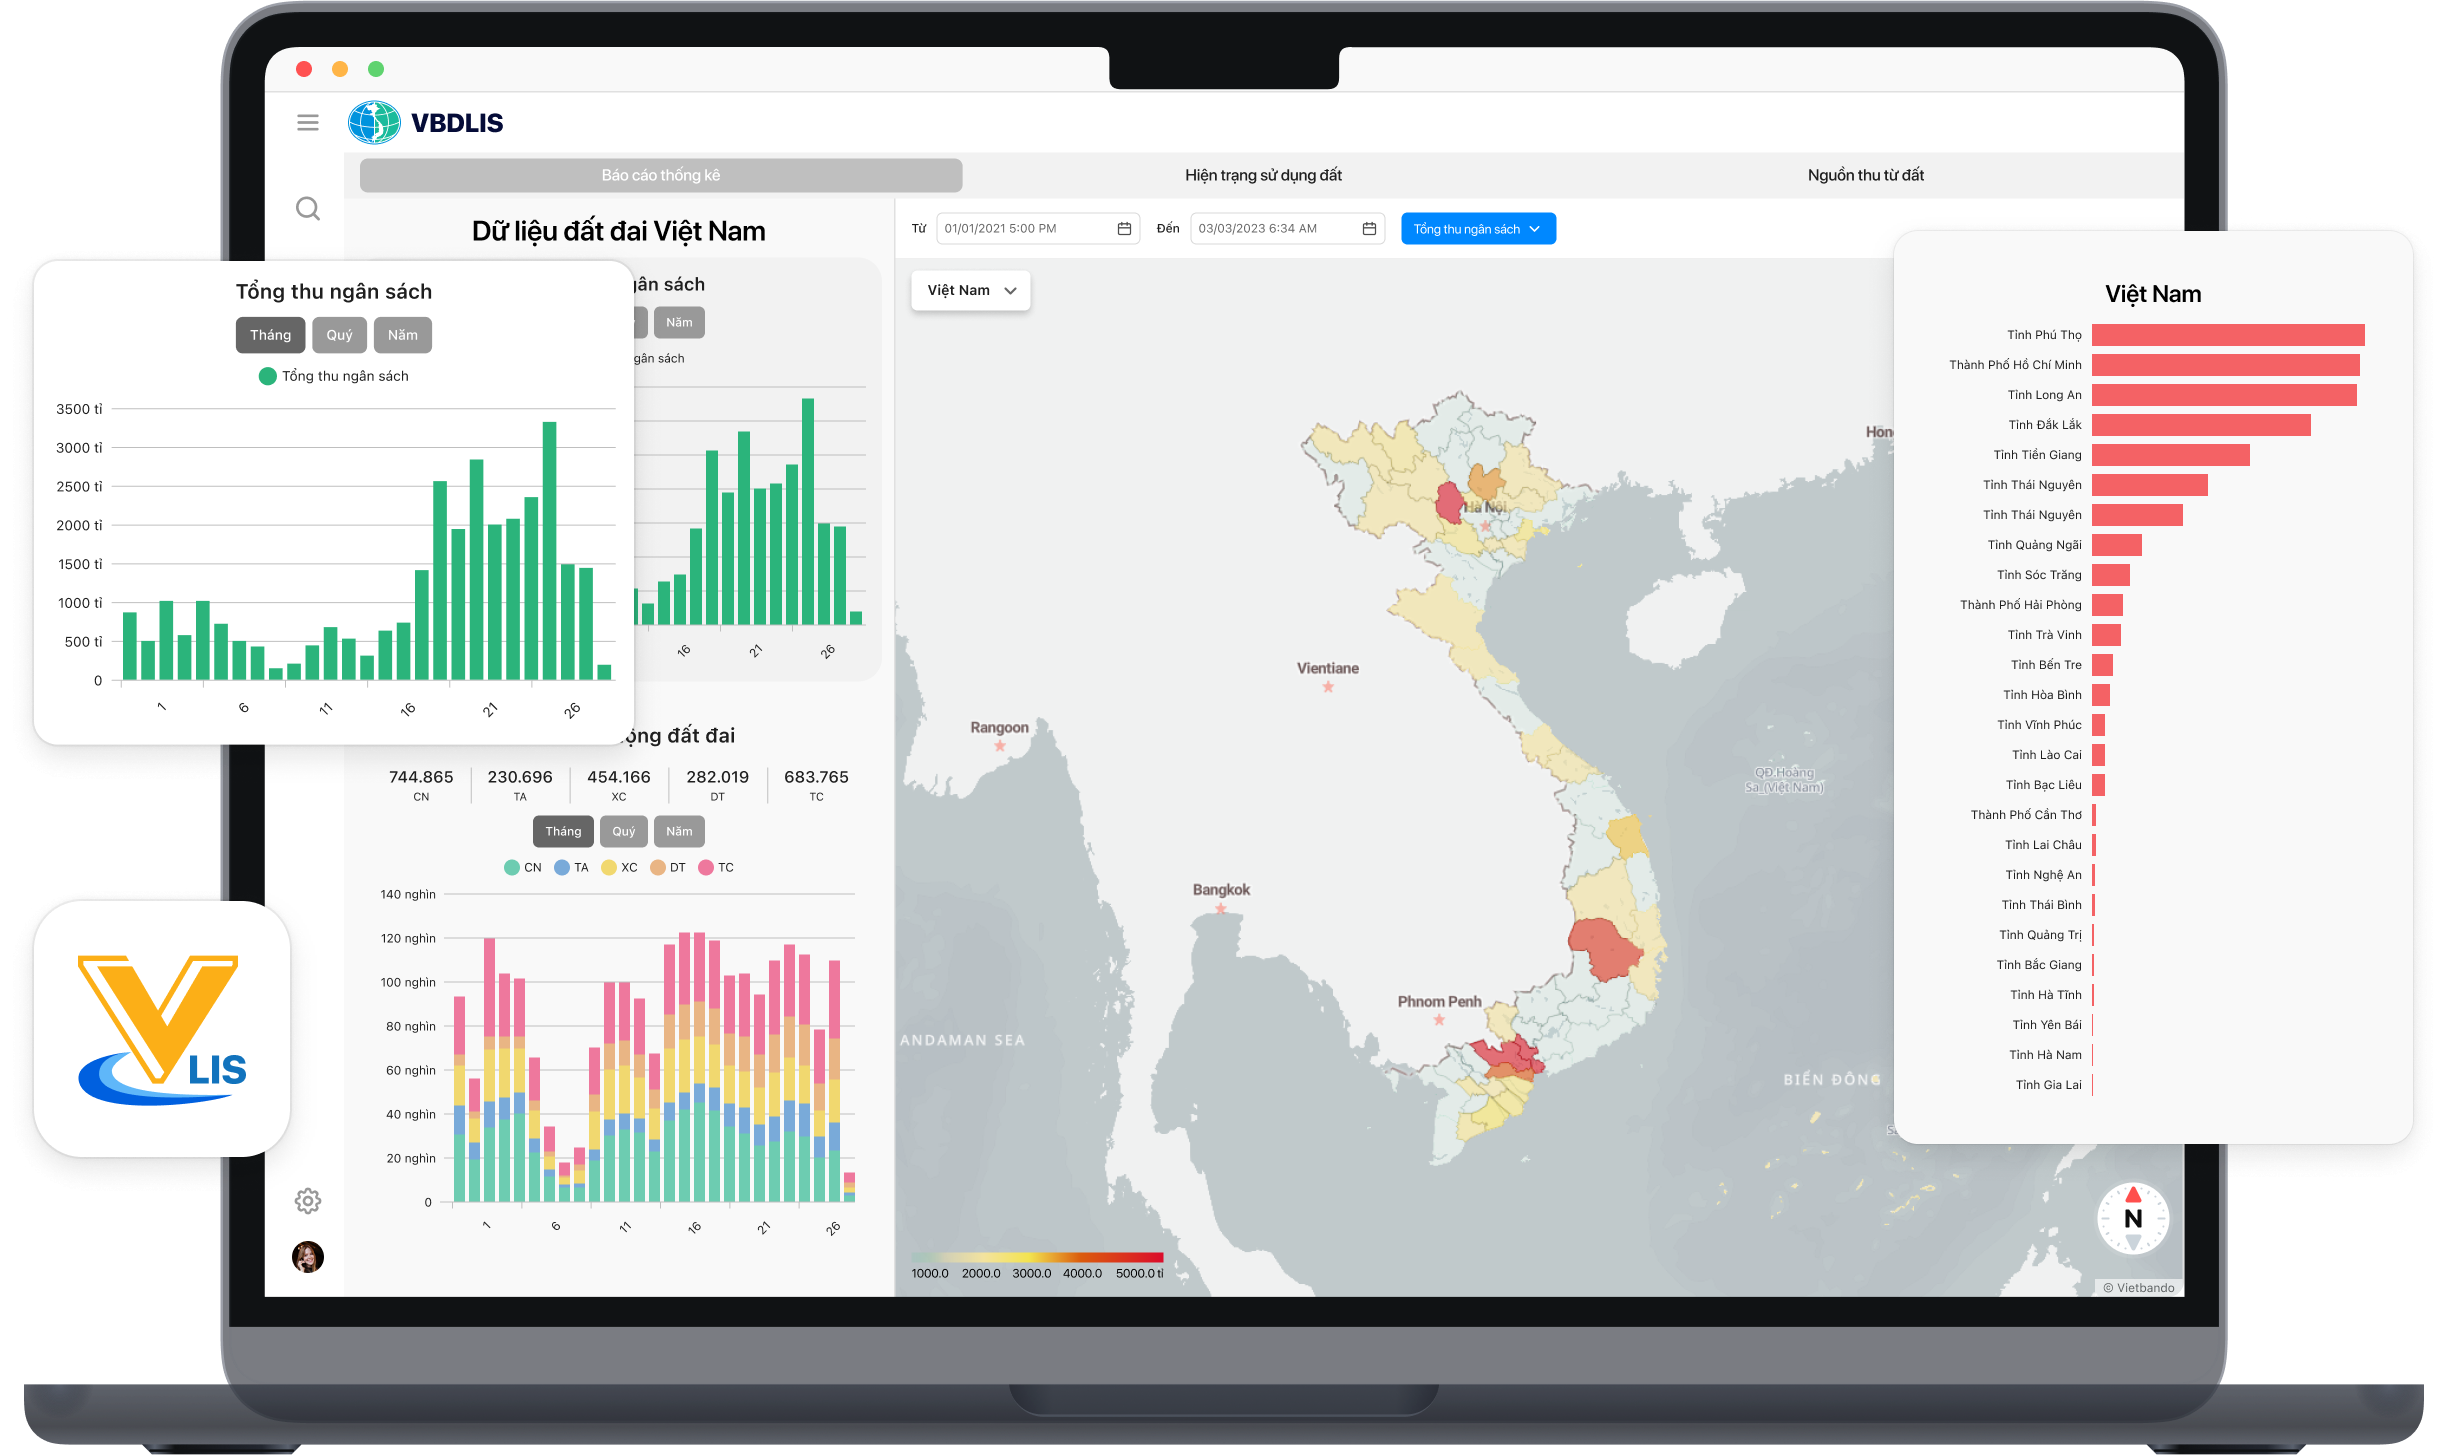
A land database can fully realize its value only when its data are accurate, complete, clean, up to date, and capable of being connected to and shared across the state management system. A study by Nguyen Dinh Trung of Vietnam National University of Agriculture and Nguyen Quang Thi of Thai Nguyen University of Agriculture and Forestry shows that applying VBDLIS in Nghe An province provided substantial support for organizing, reviewing, supplementing, synchronizing, and utilizing land data during the campaign to enrich and clean the national land database.